Using laboratory business intelligence to raise specimen collection quality and performance

A properly functioning specimen collection process is an important function for any laboratory to have in place. While many labs have specimen collection procedures to help everything run smoothly, process problems will not be detected early without daily monitoring. Failure to closely monitor specimen collection can result in significant downstream problems, waste, delays, and rework. Laboratories are increasingly turning toward business intelligence and analytics software to reveal the bigger picture.
With the implementation of a performance analytics system, managers can access detailed reports, as well as gain visual insight into the daily specimen collection process as never before. Access to fresh, useful data provides immediate insight into whether or not operational standards are being achieved. A performance analytics system offers the tools needed to identify problems and their root causes, delivering actionable information to monitor and improve the specimen collection process.
Specimen quality
Analytics tools can identify specimen defects, which is necessary in order to determine areas of improvement. Data is captured, such as how many specimens ranked Quality Non Sufficient (QNS), and the number of hemolyzed specimens with detailed information down to the collector and location. With a proper analytics system in place, managers can look up their hemolysis and QNS rates in less than a minute. The system provides insight into where a hemolyzed specimen came from, what clinic, which ward, and even the nurse or phlebotomist who drew the specimen.
While it may not be possible to retrain everyone responsible for all sample defects, it is possible to identify where most specimen defects originate, providing managers with the insight to focus retraining for the greatest effect. Reducing the occurrence of specimen defects not only saves the health system from the expense of repeat testing; it protects the patient from re-draws as well.
TAT and timely collection monitoring
Timely collections and prompt delivery to the laboratory are required for good patient care, and the ability to monitor key service commitments is of utmost importance in fulfilling this need.
Detailed reporting offers insight into the percentage of service commitments achieved, while composite reports look at the entire value stream and pinpoint where a slow-down occurred from the time the test was ordered, to the time it was collected, to result reporting. If breakdowns are easily identifiable, managers can determine whether there is a specimen collection issue and, if there is, take measures to resolve it.
As an example, Figure 1 illustrates that the composite report clearly shows the turnaround time
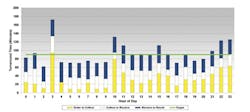
issue is not after the specimen gets to the lab; the problem is from Order to Collect in the Emergency Department (ED).
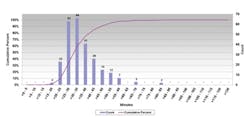
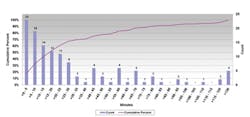
Figures 2 and 3, the histograms, reinforce the fact that specimen flow is relatively consistent once specimens are received in the lab (Receive to Verify). The pre-lab performance (Order to Collect) is where most of the extreme outliers occur, a finding that is often seen in ED testing.
Scheduled vs. actual specimen collection times
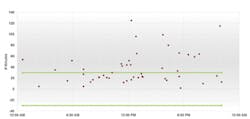
Monitoring specimen collection also allows managers to ensure that scheduled request times and actual collection times are in sync. A physician may request that blood cultures be drawn every four hours, for example, to monitor for peaks and troughs in medication. Real-time monitoring equips managers with the information to confirm whether phlebotomists or other specimen collection staff are meeting those scheduled times. Monitoring specimen collection also allows managers to evaluate the time that elapses between when a specimen is requested and when the specimen is actually collected. (Figure 4)
Phlebotomy workflow/productivity
Phlebotomists’ workflow and productivity can be monitored daily to alert hospital labs if specimens are not being processed and collected. Analytics can easily pull specific data to identify total draws per staff member, maximum per hour,
percentiles ranked against other phlebotomists, and median per-hour average draws. Managers can easily identify areas of improvement for staff.
Daily management and an engaged leadership team are essential components of performance improvement, yet more is necessary for achieving best practice performance. A key element of effective daily management is examination of performance on a daily basis. When specimen collection data is examined daily, dramatic improvements can be made in performance and root causes of performance problems can be identified and eliminated. A performance analytics system ensures that specimen collection practices are properly implemented so laboratories avoid repeat testing and unnecessary follow-up testing and, most important, protect patient safety.
About the Author

Tim Bickley, MT(ASCP), MBA, CPHIMS
Is the Vice President of Sales, Visiun, Inc.