Using analytics to manage QA and reduce laboratory errors

Today, many laboratories are still measuring their data manually, a time-consuming process subject to human error. Laboratory managers often struggle to obtain timely metrics, as laboratory information systems (LIS) provide only limited management reports, and often the metrics received are a month old and thus of limited value in improving quality and reducing errors. As a result, laboratories are increasingly turning to laboratory analytics/business intelligence as a solution to these challenges for their data mining needs. A laboratory analytics system, however, processes a wealth of laboratory data in seconds, not only ensuring that laboratory management has more time to focus on other tasks, but also providing the means for managers and supervisors to monitor and maintain higher standards of quality. Laboratory analytics are proving to be a beneficial tool in ensuring that large amounts of data can be analyzed and presented in meaningful reports that easily identify opportunities to catch and correct laboratory errors such as specimen defects, shifts in analyzer results, inappropriate utilization of laboratory tests, and can also be used as evidence of compliance (EOC) to accrediting laboratory compliance agencies.
Specimen defects and reference range changes
Laboratory analytics/business intelligence tools can assist in identifying specimen defects, which is necessary to determine areas of improvement. Important specimen information can be captured, such as how many specimens are ranked Quantity Not Sufficient (QNS), or the number of hemolyzed specimens, with detailed information such as who collected the specimen and where the specimen was collected. A hemolyzed or QNS specimen requires re-sticking a patient and can create a delay in result reporting.
With an effective laboratory analytics system in place, managers can easily view all specimens for hemolysis and QNS rates and take necessary corrective action. The laboratory business intelligence/analytics system provides insight into where a hemolyzed specimen came from, what clinic, which ward, and even the nurse or phlebotomist who drew the specimen. By performing hemolysis and QNS audits to identify patient locations and collection, staff members with the highest number and proportion of occurrences can be identified. Laboratory management can then act to identify which staff members require retraining to improve quality. While it may not be possible to retrain everyone for all quality problems, it is possible to identify where most quality assurance (QA) issues originate, providing management with the insight to focus retraining for the greatest effect.
Defective test results can pose significant financial implications to the health system when lab tests are misinterpreted and misused. An analytics system can generate a comparison of test results that allows laboratory management to see definitive analytic results to quickly answer questions about instrument performance over time. With data available daily, management can ensure that a performance problem never goes undetected and that quality managers and lab directors are kept aware of the source of laboratory problems.
Inappropriate test utilization
The consequences of unnecessary testing for patient care can include iatrogenic anemia, time spent on insignificant abnormal results, incorrect diagnoses, and longer length of stay. Various strategies can be employed to reduce overutilization of testing, including requisition redesign, hard and soft stops in the computerized physician order entry (CPOE), test formularies, education, and audits. No one strategy is sufficient, however, and an auditing capability plays a critical role. With the data from a real-time analytics system, laboratory managers will know the most important areas of unnecessary testing so rules can be developed for the electronic health record (EHR), providing soft stop guidance to physicians. A real-time analytics system also identifies common categories of unnecessary testing. These common categories range from screening/reflexing/normalcy, such as ordering an FT4 when the TSH is normal, to redundant testing such as troponin and CKMBs ordered together, to excessive frequency of repeat testing (e.g., HbA1c should not be ordered more than once every 21 days). From this, laboratory management can identify benchmarks based on tests per inpatient admission, length of stay, and length of stay vs. tests per admission. Using this data and benchmarks, laboratories can develop strategies, and measures can be taken to limit obsolete tests, limit esoteric tests, and minimize bundles of tests.
Shifts and trends in analyzer results
A laboratory analytics system can assist in reducing lab errors by providing a means to monitor quality control (QC) and assist in identifying shifts and trends in analyzer results. For example, analysis using either coefficient of variation ratio (CVR) and standard deviation index (SDI) or a standard analytical null hypothesis theory provides two different approaches to quickly determine if any instruments are reporting differently than others. An analytics system’s system also supports labs implementing the CMS/CLIA prescribed
Individualized Quality Control Plan (IQCP) based on CLSI EP23 guidelines. Best practices are identified using sigma ratings of instruments for each analyte to determine the appropriate number and frequency of QC samples to run. With real-time assessment of instrument performance, labs can know immediately if an instrument problem occurs and if their instruments are not reporting in line with other analyzers. The ability to identify reporting differences between instruments over time allows the laboratory to monitor the quality of their lab results through the analytic testing phase. Access to this type of analytics ensures that QC practices are properly implemented so laboratories can avoid repeat testing, unnecessary follow-up testing, and misdiagnoses. This is also useful for comparing lot changes, new methods, or comparisons every six months as required by accrediting lab compliance agencies.
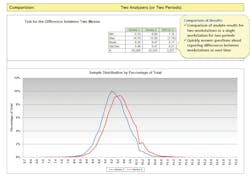
Figure 1-Identifying errors concerning reporting differences between instruments (workstations) of the same methods over time allows the laboratory to monitor the quality of its lab results. A comparison of analyte results for two workstations or a single workstation for two periods as seen on Figure 1 allows laboratory management to quickly answer questions about reporting differences between workstations over time. This is useful for comparing lot changes, new methods, or comparisons every six months as required by accrediting lab agencies.
Demonstrating evidence of compliance
Detailed laboratory analytic reporting can also be used as EOC to demonstrate adherence with requirements related to quality management by agencies such as CAP. Not only can the reporting from a laboratory analytics system offer a clear, at-a-glance guide to see what analytic reports support specific checklist requirements, but it can also be used to set benchmarks for specific quality metrics involved in quality management. Some examples include:
- Demonstrating specimen defects by comments such as cancellation reasons, result corrections, and specimen dispositions
- Analyzing specimen abnormal flags (critical values, diluted samples, delta checks) on a daily, weekly, or monthly basis
- Identifying instrument to instrument correlations for analyzers with the same test and method
- Verifying that analyzer reports automated by the LIS applied rules that are compliant
Having access to these in-depth quality reports helps to identify and reduce laboratory errors, manage QA, and ensures that laboratory management teams have adequate documentation and supporting information to demonstrate adherence to accrediting laboratory compliance agencies.
Conclusion
With data readily available, laboratory management can view all their test results and not only identify errors but also retrace their root cause, delivering actionable information to monitor and improve QA processes. Subsequently, this improves the quality of laboratory measurements and enables management to verify that all processes are operating to set standards of performance. Daily management with a laboratory analytics system and an engaged leadership team are essential components in monitoring QA and reducing lab errors. When laboratory data is managed daily, dramatic improvements can be made and errors can be eliminated, resulting in improved specimen quality, utilization, instrument/analyte performance, and patient safety.
Article updated by Vanessa Hawrylak, 2019. Originally authored by Thomas Joseph, Tim Bickley, and Kristina Ziaugra, 2016.
About the Author

Vanessa Hawrylak
MS, MT(ASCP), Technical Support Specialist, Visiun, Inc.
Thomas Joseph
MBA, MT(ASCP), President and CEO, Visiun, Inc.

Tim Bickley, MT(ASCP), MBA, CPHIMS
Is the Vice President of Sales, Visiun, Inc.