“We like March,” the American poet Emily Dickinson wrote. “His shoes are purple / He is new and high.” Here at Medical Laboratory Observer, we like March too—but not because of its purple shoes. We like March because it’s the month we get to print the MLO annual salary survey—always a revealing snapshot of your ever-evolving profession.
Every year, through the salary survey, MLO takes a look at the salary trends, education, certification, workplaces, and more that make up the world of clinical laboratory professionals. This year, some 451 respondents from every part of the United States took the time to take the online survey in January. We thank them for participating in the 2014 survey—a report on the state of the profession in the year 2014.
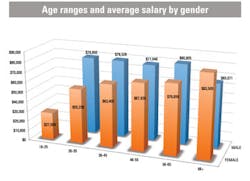
A couple of basics: The average salary in 2014, nationwide, is $71,086—$775 less than in 2013. There is a $10,002 difference between the average salaries of males and females in the profession, with females reporting $68,119, males reporting $78,021.
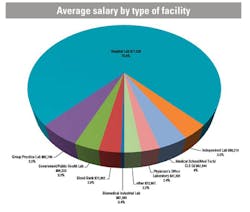
Just over three-quarters of the survey participants work in hospital-affiliated labs. Approximately 82% work in a department with 100 or fewer employees.
What follows are a few more observations based on the survey responses, to complement and supplement the graphic representations throughout this article.
Age distribution and comparison
Consistent with the results of the 2013 salary survey, the largest percentage of respondents to the 2014 survey are in the 56-to-65 age group: 39.7%. This is down from 42% in the 2013 survey findings. Respondents aged 26 to 35 continue to hold onto a small percentage at 6.9%, but note that the size of this group doubled from 2013 to 2014; the number from the 2013 survey was 3.4%. That may signify a degree of “youth-ening” of the work force, an encouraging outcome reflecting a movement within the industry.
In the 2014 survey, laboratorians in the 36-to-45-year-old category comprise a relatively small segment of the survey population at 15.3%, up slightly from 13.5% the year before. Those in the age range of 46 to 55 make up 32.6% of this year’s total, which is down from 37.2% a year ago. Survey participants age 66 and older own a small percentage of the pie at 5.3%—but this result has increased from 2.9%. It may be worth noting that the percentage of survey respondents in the oldest and the youngest categories, added together, increased from 6.3% in 2013 to 12.2% in 2014.
Salary: length of service, education and gender
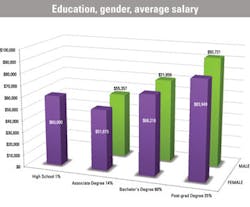
The average reported salary is $53,975 for laboratorians with an Associate degree; $68,674 for those with a Bachelor’s degree; and $86,544 for those who hold a post-graduate degree. The majority of MLO survey participants (60%) hold a Bachelor’s degree; females represent 75% of this group and males 25%. However, males with a Bachelor’s earn on average $71,059; females of equal education earn $68,216. The disparity in gender-related income also holds with regard to Associate and post-graduate qualifications. A female with an Associate degree can expect to earn $51,875, compared to $55,357 for her male counterpart. Despite our female respondents taking the lead in post-graduate certifications at 61%, on average they make almost $9,000 less than their male peers. Woman survey respondents with a post-graduate degree have an average salary of $83,949; men in that educational category earn $92,721.
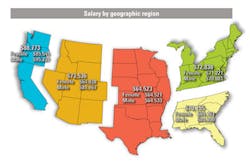
The Pacific region comes in as the highest-paying, with an average income of $88,773. Male laboratorians earn an average of $95,227 in West Coast states; females earn $85,545.
The average salary in the Mountain region is $73,536. As in the Pacific region, there is a significant disproportion between male earning power ($81,767) and female ($64,038).
The average salary in the Central region is $64,523, the lowest by region. Survey participants reveal no marked income discrepancy between the genders.
The average salary in the Northeast in 2014 is $72,838. Men average $78,081, and women average $71,221.
Increases and benefits
Of the 451 respondents, 59.4% report a salary increase, while 37.3% say their compensation stayed the same and 3.3% reported a decrease. A plurality of respondents, 36.4%, say they expect a 2%-to-4% increase in salary in 2014. 29.7% of survey participants anticipate an increase of less than 2%. Only 2.4% foresee a pay increase of five percent or more.
The “hidden money” available in laboratorians’ paychecks increased during 2013. Survey respondents report the following benefits: 100% have access to health insurance; 95.6% have the option of dental insurance; 91.1% can opt into a 401k or pension plan; 85.6% have life insurance; 79.4% have disability insurance available to them; and 7.1% have childcare availability. Unlike last year’s comparisons, which indicated an overall decrease in benefits, the 2014 survey reflects an increase in every area.
Receiving a salary, as opposed to compensation, remains an advantage for laboratorians. The 51.2% of survey-takers who are salaried employees earn on average $80,658; their colleagues who are paid on an hourly basis report earnings averaging $61,036. (As in the 2013 survey we would like to add a disclaimer on this point: We cannot verify that all of those hourly lab professionals are working the same amount of hours as their salaried peers.)
Years in the lab, years in one lab
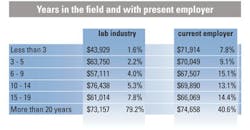
Overall, the laboratory work force is a seasoned one—and one that tends to stay put. Some 79.2% of survey participants, nearly four out of five, have been employed in the lab industry for more than 20 years. Only 1.6% have been in the lab three years or less. More that two out of five respondents, 40.6%, have been with their current employer more than 20 years; 7.8% have been with their current employer less than three years.
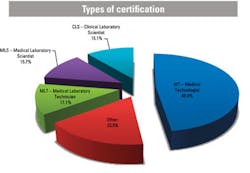
Medical technologists (MT) comprise the largest percentage of certifications reported by MLO respondents at 65.4%; followed by medical laboratory technicians (MLT) at 17.1%; medical laboratory scientists (MLS) at 15.7%, and clinical laboratory scientists (CLS) at 15.1%. The bulk of laboratorians who participated in the survey (82.9%) gained their certification through the American Society for Clinical Pathology (ASCP); 12.9% acquired certification from the National Credentialing Agency for Laboratory Personnel (NCALP). Along with individual state accrediting agencies, the NCALP and ASCP remain the two certifying organizations used by most surveyed laboratorians.
As in years past, survey participants can be proud that they belong to a profession that values professional development. Nearly 95% of respondents took at least one continuing education class in 2013, and 43.5% took more than ten.
Automation, personnel shortages, test volume
Automation continues to be a presence in labs—but the pace of automation, linked as it is to many economic and institutional factors, remains variable. Of the survey respondents, 50.1% say their lab did not automate or further automate new procedures in 2013; 49.7% say it did.
The survey asked participants what impact medical personnel shortages have had on their labs, and there is a consensus that they had some impact: 37.5% report low impact, and 35.5% moderate, and 11.8% report a large impact. Only 15.3% say personnel shortages had no impact.
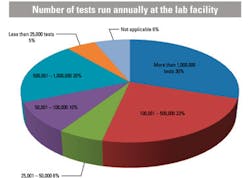
A plurality of laboratorians participating in the survey (30.2%) are affiliated with labs performing more than 1,000,000 tests annually. 20.0% perform 500,000-1,000,000 tests, and 23.3% run 100,001-500,000 tests. Only about five percent work in labs that run fewer than 25,000 tests a year.
Security and satisfaction
First the good news: The survey reveals that the perception of job security and satisfaction remains high in the profession. The percentage of laboratorians who feel secure in their current position is 86%.
It is interesting to note that the percentage of laboratorians who are satisfied with their job is exactly the same in the survey taken this year as it was in last year’s measurement: 89.1%.

