To earn CEUs, see current test at
www.mlo-online.com
under the CE Tests tab. The September test covers all articles in this
section, except the product announcement.
LEARNING OBJECTIVES
Upon completion of this article, the
reader will be able to:
MICROBIOLOGY:
- 1. Describe how Gram stains are used
to maximize patient
outcomes. - 2. Identify new automation
technology that can enhance
microbiology laboratory testing and
efficiency. - 3. Describe how to properly collect
specimens.
CHEMISTRY:
- 4. Identify organisms that commonly
cause HAIs and ARIs,
including
Clostridium difficile-associated
infection
(CDI). - 5. Name mechanisms for the increases
in HAIs, ARIs, and
CDI. - 6. Name trends in HAIs, ARIs, and
CDI.
HEMATOLOGY:
- 7. Identify organisms that commonly
cause HAIs and ARIs,
including
Clostridium difficile-associated
infection (CDI). - 8. Name mechanisms for the increases
in HAIs, ARIs, and
CDI.
Three issues plague the microbiology lab today:
- Staffing: “The U.S. Department of Health and Human
Services reports that by 2012, 138,000 lab professionals will be
needed, but fewer than 50,000 will be trained. Thirteen percent of
the current laboratory staff is likely to retire in the next five
years.”1 “There are two incoming clinical laboratory
scientists for every seven retiring; 100,000 positions vacant by
2012.”2 The bottom line is that experienced microbiology
technologists are hard to come by these days. - Workload: Mandatory MRSA screening, increasing organism
resistance requiring specialized testing (i.e., “D” test, Hodge
test), and an increasing number of infections. Overall, these
factors contribute to an escalating workload in microbiology. - Demand: The microbiology department faces pressures from
many areas within the organization: Administrators are cutting
budgets; physicians are demanding results sooner; and government is
telling administrators that it will be denying payment for
healthcare-associated infections (HAIs).
How does the microbiology laboratory deal with
such pressures? By taking three simple steps:
- Ensure the laboratory is collecting, transporting, and plating
specimens following basic microbiology principles. Just because it
grows in culture does not always mean that there is a real infection
process going on. - Perform tests that improve services, patient care, and
therapeutic choices. - Utilize staffing resources efficiently; automate as much as
possible; and develop processes that improve overall efficiency,
reduce cost, and add value to patient care.
High-quality specimens lead to high-quality
results and better patient care. Whether the laboratory is performing
rapid antigen and/or polymerase chain reaction (PCR) testing; has access
to automated plate streaker or automated antimicrobial susceptibility
test (ID/AST) instruments; and/or has processes designed with high
efficiency and less manual labor — the microbiology result will always
be dependent on specimen collection, first and foremost.
Most microbiology laboratories have quality
indicators that center on basic specimen collection. The age-old saying
“garbage in garbage out” is the basis for good microbiology practice.
Those who collect samples for the microbiology laboratory need to be
monitored and given feedback regularly, so they become acutely aware of
how they affect patient care. A poorly collected specimen can lead to
many scenarios ranging from:
- false-negative cultures to inappropriate or unnecessary
antibiotics given to patients (which lead to organism resistance),
to - treating patients for infections they do not have (as in the
case of a contaminated blood culture) and extending their hospital
stay.
With today’s emphasis on HAIs, specimen
collection is even more important than ever before. “Do it right the
first time” should be the mantra for microbiology labs; spend more time
upfront ensuring that specimens processed in microbiology labs are
quality
specimens.
How can lab professionals ensure that the specimens received in the lab
are high quality? Training nurses and phlebotomists on the proper
technique for collecting blood cultures is warranted. Concentrating on
specimen collection can save a laboratory and an institution thousands
of dollars in costs associated with antibiotics, labor, and length of
hospital stay. The blood culture contamination rate in a lab may be well
below the 3% national benchmark; however, consider this simple exercise:
According to the article “Controlling blood
culture contamination rates,”3 contaminated blood cultures
costs an average of $5,000 per incident, and patients stay in the
hospital an extra 4.5 days — and keep in mind that these are 2004
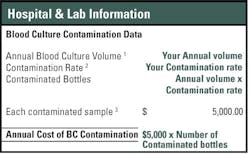
figures. If a lab performs 1,000 blood cultures per month, it is working
up 360 bottles that are contaminated per year, costing the facility
$1,800,000 per year at minimum. Also, patients are staying 1,320
additional days. Investing effort upfront in educating the staff can
save a facility thousands of dollars.
Aside from blood-culture contamination, many
microbiology laboratories have other monthly quality indicators such as
contaminated urines, sputum quality, corrected report rates, and more.
What do you do with this information? The premise for performing these
quality indicators is to communicate back to nursing or the specimen
collector how well they are performing collection practices, or to
implement practices that would improve the quality indicators. Several
actions can be taken to improve the quality of specimens. For example:
- Boric-acid urine collection tubes cut back on contamination of
urine samples. - There is no need for refrigeration; simply expedite transport to
lab, especially if many of the samples come from outreach programs
and nursing homes.
Another aspect to consider is collection methods
that do not require additional allocation of specimens once in the lab.
Frequently, nurses collect the specimen (i.e., urine, stool, body
fluids). After that specimen is received in the lab, it might be
allocated to different departments (e.g., urines split between
urinalysis and microbiology) and/or different procedures (e.g., stools
split for O&P, culture, and occult bloods). With the strong emphasis on
LEAN/Sigma today, consider having a collection procedure that allows for
collection, preservation, transportation, and allocation performed at
the origin of the collection (i.e., by the nurse). Stool, urine, and
sterile body fluids samples are perfect examples for these types of
LEAN/Sigma collection practices, and many collection containers are
available to support this practice.
The Gram stain is still the most important
first result from the microbiology laboratory. It is imperative
that Gram stains not only are performed properly but also performed on
appropriate specimens and read in a timely fashion to provide
preliminary results on which a physician can act. Gram stains conducted
on an inappropriate specimen, such as stools and urines, also can give
misleading results to a physician. (One resource for performing on
appropriate specimens is the Clinical Microbiology Procedures
Handbook from ASM Press.) In today’s microbiology laboratory
environment where more and more procedures are being performed, the
“bugs” are getting more resistant; and microbiologists are retiring at a
steady pace, review protocols and determine if the lab is doing
unnecessary or outdated procedures or procedures such as primary Gram
stains on stools and urine specimens.
Are Gram-stain results available to the physician
on Day 1? Clinicians use the Gram-stain results to validate their course
of treatment. If the Gram-stain result is reported the same day as the
preliminary report of the culture, then this is essentially a worthless
result as well as a wasted effort. Monitoring Gram-stain turnaround
times? A good benchmark for STAT Gram stains is one hour; four hours for
routine Gram stains.
Rapid test technology
Little has changed in the microbiology laboratory
in terms of how cultures are done. Specimens still need to be collected,
transported to the laboratory, plated, incubated overnight, and
evaluated the next day. This process still takes 18 to 24 hours. But
today, physicians want results sooner. Literature suggests that rapid
microbiology results impact lives and lower patient costs. According to
Doern, et al, rapid results lead to fewer imaging procedures, fewer days
on intubation, fewer days in intensive-care units, and decreased length
of hospital stay.
This does not mean that the lab has to do PCR
tests on everything. Before jumping into the world of molecular, a
medical laboratory needs to answer several questions:
- Is this test result going to improve service/patient care?
- Will this test result change/improve therapeutic choices?
- Is this a high-volume test that makes it budget neutral?
Additionally consider that there are a few
instances where laboratory tests require molecular testing:
- where sensitivity of the test is critical (i.e., HSV-1);
- encephalitis where culture is dangerous (i.e., small pox, SARS),
and - where quantitative analysis is necessary (i.e., HIV viral load).
Molecular testing is not for every lab, and not
every lab has the same needs.
Automating micro
Today’s microbiology lab needs to use automation
as much as possible to perform tasks that are repetitive and/or
frequently batched, that can be standardized, and/or that eliminate
multiple steps in a process.
Automation of blood culture and identification,
and ID/AST systems enables microbiology labs to work more efficiently
and report ID/AST results much faster. Develop ID and susceptibility
reporting practices on the basis of when results are available
with the automated ID/AST system. For example, today’s technology allows
for ID/AST results to be available within 8 to 10 hours. So implementing
reporting strategies that allow results to go to the patient cart the
same day will improve laboratory result turnaround time. According to
Barenfanger, the average length of stay can be decreased by
two days, average turnaround time by 5.2 hours, and mortality by 1.7%.
The average total cost savings per result is $2,395. 5
Other types of automation available today
contributing to increased efficiency are automated Gram stainers and
plate streakers. This type of automation is thought by some to be best
suited for large-volume laboratories. Weighing the challenges discussed
here, consider the advantages of these systems, and study how automating
these processes could improve overall microbiology efficiency. Evaluate
Gram staining: Does the lab perform Gram stains 24/7? Do those Gram
stains performed have to be reviewed on other shifts? Are many of the
Gram stains performed on second and third shift over- and/or
under-decolorized? Is this causing additional workload for the
microbiology lab? Are corrected reports being generated? If this is the
case, look at automating the Gram-staining procedure, which would
standardize this process and procedure.
Consider similar scenarios for the automated
plate streaker. How many cultures and patient results are delayed due to
poor isolation technique? How many re-isolations are being done in the
lab? How many ID/AST cannot be done the first day due to poor isolation?
These issues can be resolved with an automated plate streaker. Automated
plate streakers not only help reduce labor associated with streaking
plates but also add benefits such as increased capacity, and improved
turnaround times improved efficiency in processes, and shift the
workload from non-technical tasks to brain-oriented tasks often
associated with microbiology cultures.
Going “back to basics” to review processes in the
laboratory can also be an opportunity to invite an outside
organization’s review, which can be beneficial.
Anne R. Beall, corporate accounts project manager
at bioM’erieux Inc. in Durham, NC, has 22 years of experience in the
clinical microbiology laboratory as well as substantial knowledge of
automation and LEAN/Sigma.
References
- Wage and Vacancy Report: Laboratory Workforce Shortage Reaches
Crisis. Retrieved from
http://www.ascp.org/MainMenu/students/Laboratorystudents/ASCP-Wage-and-Vacancy-Report.aspx.
Accessed on October 28, 2009. - Bersch C. Retirement challenge looms. MLO. 2008;40(1):4.
- Ernst DJ. Controlling blood culture contamination rates.
MLO
2004;36(3):14-18. - Doern GV, Vautour R, Gaudet M, Levy B. Clinical Impact of Rapid
In Vitro Susceptibility Testing and Bacterial Identification. J
Clin Microbiol. 1994;32(7):757-1762. - Barenfanger J, Drake C, Kaich G. J Clin Microbiol.
1999;37(5):1415-1418.
Details create the big picture
By Debbi Tiffany, MSEd, MT(ASCP) SC, SLS
In clinical chemistry, the evolution of how
data is utilized by caregivers continues to require laboratories to
respond with increasing layers of detailed information. As more health
insurers and government agencies seek measurement of the quality of
patient care, the laboratory is poised to provide that data, often from
information it already has.
eGFR as adjunct/replacement
Adoption of the calculated glomerular filtration
rate (also known as electronic glomerular filtration rate, or eGFR) as
an adjunct to or replacement for the 24-hour urine creatinine clearance
test has not been without its problems. Using the serum creatinine,
gender, age, and race, it is possible to calculate the glomerular
filtration rate — the basis of the traditional creatinine clearance test
— but without the usual problems associated with 24-hour urine
collection. The impetus to performing this calculation stems from the
National Kidney Disease Education Program, whose primary goal is to
improve the early detection and treatment of kidney disease. Many labs
continue to struggle with the mechanics of providing this calculation to
their physicians. Issues encompass:
- which calculation to use (Modification of Diet in Renal Disease,
or MDRD, or Cockcroft-Gault); - whether or not the laboratory information system can support the
calculation; and - whether or not to calculate the eGFR on all creatinine tests
performed by the laboratory or specifically by request.
While these studies are far from definitive at this point,
the popular press has taken kernels of information and
helped spur the demand for vitamin D testing.
Many instrument and reagent vendors have adopted
the isotope-dilution mass-spectrometry (IDMS) standardization for their
creatinine methods, although this method is still not universal. The
difference in creatinine values between IDMS and non-IDMS methods, along
with normal ranges, makes eGFR testing an ongoing situation that
requires good communication between the laboratory and caregivers who
utilize creatinine test results.
The EAG calculation debate
Vitamin D
There is probably not a clinical-chemistry
laboratory in the country that has not experienced a marked increase in
the number of requests for vitamin D testing. Low vitamin D status has
long been associated with osteopenia, osteoporosis, and fracture risk.
Meta-analysis has provided some intriguing possibilities, associating
low vitamin D levels to increased risk of certain cancers, type 1
diabetes, heart disease, multiple sclerosis, Alzheimer’s disease, and
overall mortality. While these studies are far from definitive at this
point, the popular press has taken kernels of information and helped
spur the demand for vitamin D testing. But what can be termed a low
vitamin D level? Unlike glucose or sodium, where population studies can
define a true normal range, vitamin D levels have many variables that
must be considered to determine a normal range. Because of the effect of
sunlight on 7-dehydrocholesterol in the skin, vitamin D levels are
affected by such variables as season, geographic location, population
ethnicity, and gender. Establishment of a meaningful normal range would
have to include these variables. Our immediate knowledge of vitamin D
metabolism and what should be considered “healthy” levels is also based
on dietary intake recommendations that are more than 50 years old.
Currently, the Institute of Medicine is
conducting a study to determine updated dietary-intake levels for
vitamin D. It is expected that the existing adult recommended daily
intake of 200 IUs to 400 IUs will be adjusted based on more up-to-date
scientific data. Finally, laboratories need to be aware of the lack of
method standardization for vitamin D testing at this time. Different
methods will yield different results, which can lead to confusion if a
physician utilizes different laboratories for vitamin D testing and
tries to compare the two values. The National Institute of Standards and
Technology is now working on providing standardized reference material
for quality control and calibration of vitamin D testing. As with eGFR
and EAG, ongoing communication between the laboratory and physicians
regarding the ins and outs of vitamin D testing will be essential in
providing meaningful details to create the big picture of patient care.
Debbi Tiffany, MSEd, MT(ASCP) SC, SLS, is the
director of Laboratory Services at SwedishAmerican Health System,
Rockford, IL.
What’s new in
By Jeanne M. Isabel, MSEd, CLSpH(NCA)
Worked in the hemostasis department lately? No?
You may be surprised to find some new testing protocols. Hemostasis is a
discipline that is greatly affected by treatment therapies and new
medications that appear in the marketplace; hemostasis is a study that
makes keeping up with testing technologies difficult and the world of
pharmaceuticals even more challenging.
Using the Fritsma Factor
Did you know that PCR testing of saliva for
CYP2C19 associated with clopidogrel is being done by Quest Diagnostics?
The test may be used to screen patients prior to clopidogrel therapy in
an effort to establish the correct dosage or to switch to alternative
anti-platelet therapy. It is the first saliva-based PCR available for
clinical testing.
The updated laboratory testing guidelines are
available online from the 2009 International Society on Thrombosis and
Hemostasis regarding an update for lupus anticoagulant detection. This
report appears in the October 2009 Journal of Thrombosis and
Hemostasis. Some highlights include grading for appropriateness of
testing, double centrifuging for platelet-poor plasma, and tests that
are not recommended, to name a few. Both of these topics are
covered on the Fritsma Factor website (see The Fritsma Factor below).
Check out CLSI
www.clsi.org/source/orders/free/h58-A.pdf , provides sections addressing different methods of aggregometry testing. Readers can find information on a particular method or area of interest, such as specimen storage and transfer temperatures, sample selection for various methodologies, establishment of reference intervals, result reporting, result analysis, assay validations, and troubleshooting. Douglas J. Christie, PhD, F(AHA), chair of the subcommittee that developed the document, points out that “platelets, regardless of their absolute numbers, may be suboptimal in function and lead to a clinical bleed.”1 Platelet function may also be suppressed by use of medication in treatment.
Read more about the basics of platelet
aggregometry in the 2007 article by George Fritsma in Clinical
Laboratory Science,2
the journal of the American Society for Clinical Laboratory Science,
which outlines the specimen requirements and methodology for
platelet-function testing by aggregometry and lumiaggregometry. A
description of the various agonists used in aggregometry is listed,
along with a summary of responses in various platelet disorders. This
issue of the journal also has focus articles on thrombocytopenia and
qualitative platelet disorders.
Platelet activation, oral anticoagulants, and more
Research on new cardiac markers and treatment
strategy effects on platelet activation is described by Storm, et al.
These researchers have identified “whole blood choline as a potential
marker reflecting coronary plaque instability, platelet activation, and
tissue ischemia.” A standard treatment for patients with troponin-positive
acute coronary syndrome is tirofiban which is a “short-acting
non-peptide inhibitor of the GPIIb/IIIA receptor.”3 Aspirin
and clopidogrel represent current standard antiplatelet agents blocking
platelet cyclooxygenase-1 and thromboxane A2. This new drug is
associated with a lower incidence of ischemic events.
For information beyond the scope of anti-platelet
therapy, updates related to oral anticoagulants, unfractionated heparin,
and direct thrombin inhibitors is the focus in Clinical Laboratory
Science 2004, issue two. There are a large number of adults on oral
anticoagulant therapy, and regulation of the correct dosage to get the
INR in the therapeutic range may take some trial and error.
A list of drugs that potentiate vitamin K
antagonist and those that decrease anticoagulant response is included in
the article by David McGlasson.4 A comparison of
unfractionated heparin and low molecular weight heparin (LMWH) is
discussed in the article by Adler.5 This article also
includes a discussion of the preferred method of monitoring LMWH by
chromogenic anti-Xa assay. Then look at the Fritsma Factor website to
view the question/answer discussion on antithrombin in the anti-Xa
assay.
Whether a seasoned hematologist or a generalist
being asked to cover new departments, use these resources for current
information. The quest for continuous education keeps getting more
convenient.
Jeanne M. Isabel, MSEd, CLSpH(NCA), is an
associate professor at the School of Allied Health Professions in the
College of Health and Human Sciences at Northern Illinois University,
DeKalb, IL.
References
- McDaniel G. Standardization of platelet function testing by
aggregometry through new CLSI guideline. Lab Medicine.
2009;40(5):269-270. doi10.1309/LMIZX13GDWBBH9NA - Fritsma G. Platelet function testing: Aggregometry and
lumiaggregometry. Clin Lab Sci. 2007;20(1):32-37. - Storm C, Oliver D, Lueders C, Ulrich F, Moekel M. Effect of the
glycoprotein IIb/IIIa inhibitor tirofiban on concentrations of whole
blood choline in acute coronary syndromes.
Lab Medicine. 2008;39(6):349-355. - McGlasson DL. (2004). Oral Anticoagulants.
Clin Lab Sci. - Adler BA. Unfractionated heparin and other antithrombin
medicated anticoagulants. Clin Lab Sci. 2004;17(2):113-117.
The Fritsma Factor is an online resource for
keeping up to date and obtaining answers to questions on hemostasis at
www.fritsmafactor.com. The Fritsma Factor, an interactive
resource, was started by George A. Fritsma, MS, MT(ASCP), as a resource
for laboratory practitioners to share information and knowledge. No
matter if information is needed about hemostasis conferences,
abbreviations, audio modules, or a forum for asking a question, the
Fritsma Factor is the place to look. The website features a blog with
commentary and news; an “Ask George” section where Fritsma answers
questions submitted by readers; and educational presentations.
Fritsma is an associate professor in the
Department of Pathology at the University of Alabama-Birmingham where he
started the website
http://uabcoag.net, another comprehensive source of information
for both lay people and healthcare professionals. This website features
a comprehensive list of thrombotic or hemorrhagic conditions along with
a list of laboratory assays that may be used to assess risk, diagnose,
or monitor the conditions; a glossary of hemostasis terms with
abbreviations; and reference intervals for infants, children, and adults
with thrombotic or hemorrhagic disorders.


