Launching a successful cost of poor quality project
Cost of Quality (COQ) programs are widely used across virtually all industries, having been first introduced in the 1950s by Joseph M. Juran (1904–2008), a Romanian-born American engineer and management consultant. He was a highly regarded pioneer in quality and quality management. COQ formally appeared on the modern medical laboratory scene in 2014 with CLSI’s Report, Understanding the Cost of Quality in the Laboratory.1 In recent years, there have been many COQ articles and seminars available to medical laboratories.
There are both good and poor quality costs. Good quality costs consist of prevention costs and appraisal costs. Poor quality costs consist of internal failure costs and external failure costs. A lab that spends more up front on appropriate prevention and appraisal costs can significantly drive down internal and external failure costs.
In an article titled, Exploring cost of quality in the lab,2 published in the December 2018 issue of MLO, core COQ concepts were reviewed along with ideas for how to get started.
In this article we’ll explore ways for laboratory staff to get started with a specific COQ project that may help demonstrate the return on investment (ROI) to administration.
Identifying a project
Once a laboratory decides to start tracking COQ, it is recommended to start with a pilot project. A lab will often have some sort of trigger that prompts the desire to track costs associated with failures. A pilot project will help the lab get its feet wet before implementing a full-fledged COQ program.
When selecting the focus of the COQ project, consider what types of non-conforming events (NCEs) the laboratory experiences that likely have the most impact on the lab’s budget and/or patient safety. Perhaps the lab experienced a few serious mislabeling errors or turnaround time issues for STAT specimens. Or perhaps the lab frequently experiences lower severity issues such as Quantity Not Sufficient (QNS) specimens, demographic data entry errors, or quality control (QC) failures. Whatever the case may be, try to zero in on the issues that it is fair to assume cumulatively cause your laboratory the most problems. Select one or maybe two issues for your pilot project.
Outline data collection plan and data capture
It will first be necessary to determine what tool will be used for the COQ initiative. There are laboratory focused templates1,3 that can be used as a starting point. Start with one of these templates (or devise your own) and consider if all types of failure costs that the laboratory may experience are reflected.Hospital laboratories that perform collection and deliver results to doctors within the organization receiving results will have a broader workflow to consider than a reference laboratory will.
It is also prudent at this stage to introduce the project to key management so they can provide input before data is collected. This will make it more likely that they will understand and value the results of your project. It will also be necessary to determine the duration of the project, how data will be stored, and responsibilities for capturing data.
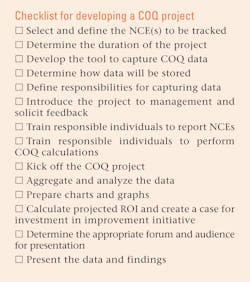
Before the project is started, ensure that all responsible staffers are appropriately trained on what NCEs to include in the project, use of the tool, and COQ calculation (as applicable). See Figure 1 for a simple checklist for developing a COQ project within your laboratory.
Aggregate and analyze the data
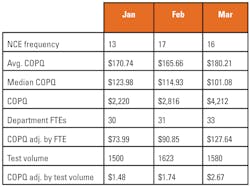
Once data has been captured for the defined period of time or at an interval that makes sense (such as monthly or quarterly), aggregate and analyze the collected COQ data. A simple spreadsheet can be very helpful in facilitating aggregation and the generation of charts and graphs. It is helpful to demonstrate the failure costs associated with the NCE(s) over time, as well as average and median failure cost values.(Figure 2)
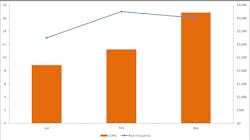
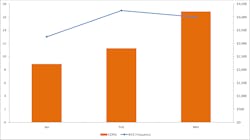
Charts and graphs can also help to visualize the aggregated data. (Figure 3) It is worth noting that denominators should be included where possible to ensure that the organizational context is properly understood over time. It may be that the organization grew from 10 to 100 employees or perhaps volume decreased 30 percent over the time period being tracked. Adjusting NCE frequencies and COQ values with appropriate denominators such as full-time employee count, revenue, and test volume can help to ensure that fluctuations, such as growth and attrition, are accounted for. (Figure 2)
Be prepared, as the data collected may be surprising! Many times, the true financial implications for a particular NCE are not fully appreciated until this exercise is carried out.
Create a case for investment in quality improvement
Once the aggregated data is analyzed and confirms that there is an opportunity for improvement—both from a quality perspective as well as financial—determine the root cause of the NCE in question. Determine what types of costs of good quality (COGQ) will be necessary to eliminate it.
Perhaps revising a standard operating procedure (SOP), implementing a new internal audit, or training staff will be necessary. It is possible a more significant investment will be necessary such as automation or a newly created position. Be conservative yet thorough in the selection of the proposed corrective action that will eliminate the root cause of the NCE.
Next, calculate how much this corrective action will cost the organization. Be as accurate and concise as possible. Annualize the failure costs that you calculated earlier in the project and consider this the amount that will be gained over the next year should the proposed corrective action prove successful. Calculate an ROI for your proposed corrective action. (Figures 4 and 5)
Present the data
Now that the cost of poor quality (COPQ) data and justification for investment in COGQ has been calculated, it is time to present the information.
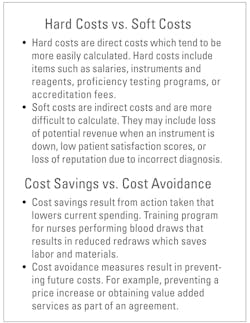
First, determine the appropriate audience and forum. It may be that the lab has a monthly quality improvement meeting or perhaps it will be necessary to schedule a meeting for this purpose. Consider the audience the information will be presented to and their differing viewpoints. Review the presentation and ensure that it effectively makes the case intended. Before you present, understand the difference between hard and soft costs, as well as cost savings, and cost avoidance. (Figure 6)
It is helpful to have more granular calculation COPQ and ROI calculation data handy while presenting information in the event that any of the numbers are called into question or if any of the attendees have specific questions.
Conclusion
Developing a pilot COQ project is a cost-effective and educational way of moving your laboratory to longer-term and ongoing COQ programs that will benefit your organization as a whole. It is also the most efficient way to demonstrate the value of COQ principles to your laboratory’s financial decision-makers. A successful project will help you demonstrate to administration the value that tracking COQ can provide and ultimately achieve buy-in for larger-scale programs at all levels of your organization.
REFERENCES
1. Clinical and Laboratory Standards Institute. “Understanding the Cost of Quality in the Laboratory: A Report.” CLSI Report QMS20-R. 2014.
2. Quintenz A. and Williams P. “Exploring the Cost of Quality in the Laboratory.” MLO. December, 2018.
3. Dawson J, et al. “Calculating the Cost of Poor Quality: a Multi Facility Study.” Poster presented at American Association for Clinical Chemistry Annual Meeting. Chicago, IL. August, 2018.
About the Author

Jennifer Dawson
serves as a Lab Quality Consultant with Pinnacle Lab Quality. She specializes in development, deployment, and redesign of best practice Quality Management Systems and cultivation of a culture of quality.

Andy Quintenz
serves as Scientific and Professional Affairs Manager for Bio-Rad Laboratories Quality Systems Division.
