MLO’s 2017 laboratory professional annual salary survey: A snapshot of our time
The American poet Emily Dickinson wrote, “March is the month of expectation.” The belle of Amherst might have had other things in mind, but for readers of MLO, what they expect in March is to read the results of the MLO annual salary survey. We are pleased to meet that expectation, and as always we begin by thanking all who participated.
The demand for services from the nation’s medical laboratories, which is predicted to dramatically increase as our citizens’ age, carries with it a demand for new strategies and approaches. Even as our most experienced laboratory professionals retire over the next decade or so, the lab must continue to recruit and retain educated laboratorians, maintain momentum, and overcome new challenges. Outreach, automation, and personalized medicine, among other trends, will all be part of the future of the clinical lab, and that future will require advocacy, communication, and collaboration.
MLO’s 2017 annual salary survey for laboratory professionals collects not only information about employee compensation and benefits, but about job satisfaction, education, and a variety of other things that have an impact on the future direction of laboratory medicine. Like all surveys, it is a snapshot of a moment in time. So let’s have a look at what “the survey says….(bing)!”
Some preliminary demographics
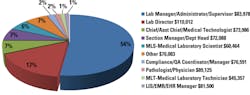
Is there a “typical” clinical laboratorian? No. But MLO’s survey results suggest that a good number of today’s lab workforce fit a certain profile. More than 70 percent of the survey respondents are Lab Managers/Administrators/Directors. More than 80 percent have worked in the industry for more than 20 years. Just over half have worked with their current employer for 15 years or more. About three-quarters work in a hospital-affiliated lab. About seven in ten respondents are female.
Now let’s look more closely at these generalizations in context, and at some of the other results of the 2017 survey. We’ll also compare them with the analogous statistics from the 2016 survey where that is most relevant.
The salary basics
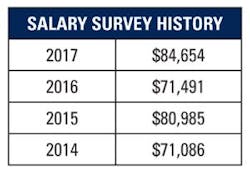
The average salary as reported by the 2017 survey is $84,654; that is a significant increase from the 2016 survey figure of $71,491. Since most survey respondents did not report a major increase in salary during 2016, that statistic may seem surprising. However, most of the change can be explained from the percentage differences in respondent job functions. In last year’s survey, 32.4 percent of respondents were Lab Managers, with an average salary of $77,077. Six percent were Lab Directors, with an average salary of $112,114. Of this year’s survey respondents, 53.6 percent were Lab Managers, with an average salary of $83,978, and another 16.8 percent were Lab Directors, with an average salary of $110,012. The survey had more senior people responding this year than last.
There may be another factor at work, though, and that is the aging of the lab workforce. About six percent of respondents in this year’s survey were under 35, approximately half the number in that age group last year, and that might have helped bring the average salary numbers up. Whatever the reason(s), as you will see in what follows, reported salaries were higher by most measures in 2017 as opposed to 2016.
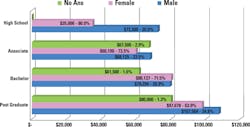
According to this year’s survey, the average salary for a female laboratorian is $83,199 ($69,381 in last year’s survey.) The average salary for a male is $89,084 ($81,857 last year). As has been the case most years, there were significant differences in average salary among the regions of the United States (see regional map).
Another major difference between this year’s numbers and last year’s is that 31.4 percent of the respondents told us they were hourly this year, as opposed to 53.5 percent last year. This could be another factor in the apparent boost in pay.
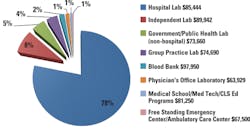
Nearly four out of five respondents (78.3 percent) work in hospital-affiliated labs, as opposed to a slightly smaller percentage last year (74.1 percent). The largest number of respondents this year (24.6 percent) work in labs with 21 to 50 employees, with labs with one to 10 employees a close second (22.8 percent). In last year’s survey, just under 27 percent worked in labs with one to ten employees, and just under 25 percent in labs with 21 to 50. Statistically insignificant, or the beginning of a trend? It will be interesting to see what happens with those numbers next year.
Salary and education
With regard to highest academic degree, 61.6 percent hold a bachelor’s degree, up slightly from last year’s 60.2 percent. The average salary for these laboratorians is $79,616, substantially higher than last year’s $69,740. 30.8 percent hold post-graduate degrees, up from 25.1 percent last year, and their salaries averaged $100,896, compared with $88,495. 6.6 percent hold Associate degrees, approximately half of the 12.8 percent who held two-year degrees in last year’s survey. Associate degree holders’ 2017 salary averaged $62,206—substantially higher than last year’s figure of $48,021. That jump cannot be related to a greater number of management people among our respondents this year, as holders of Associate degrees will not be Lab Managers or Directors. What those numbers are saying, perhaps, is that staff shortages are causing salaries to rise even among laboratorians with less formal education.
Age distribution and comparison
The highest number of respondents in the 2017 survey were in the 56-to-65 age group: 42.3 percent. This is essentially the same as in the 2016 survey year, when the corresponding number was 42.5 percent. This year, 28.3 percent of respondents were in the 46-to-55 age group, compared to 22.2 percent last year. There was a downturn in the number in the 36-to-45 age group, from 17.1 percent last year to 13.3 percent this year, and the number in the 26-to-35 age group also fell, from 9.6 percent a year ago to 5.8 percent this year. The laboratory workforce is not getting any younger, not yet anyway.
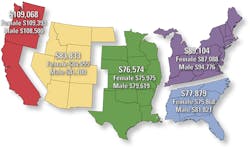
Salary by geographic region
As has been the case for the last two years, the Pacific Coastal region comes in as the highest-paying, with an average salary of $109,068 ($109,353 for women $108,500 for men).
- In the Mountain region, the average salary is $83,833 ($84,455 for women, $81,100 for men).
- In the Central region, the average salary is $76,574 ($75,975 for women, $79,619 for men).
- In the Northeast, the average is $89,104 ($87,088 for women, $94,776 for men).
- In the Southeast, the average is $77,879 ($75,868 for women, $81,121 for men).
As was the case last year, the salary seems to drop as we go from west to east, with some recovery in the Northeast; this is probably in part a reflection of the cost of living in the different regions of the nation. Also repeating last year’s pattern, women’s salaries were higher than men’s in the Pacific (marginally this time) and the Mountain regions, but men’s were higher in the other three regions. This is a little puzzling, and our data does not give us any explanation for why this is so. One observation: the disparity between men’s and women’s salaries, whichever direction it goes in, is significantly less across the regions in this year’s survey than in last year’s; in the Northeast, for instance, men’s salaries averaged more than $20,000 higher than women’s last year, while this year the difference is $7,688.
Increases and benefits
Nearly seven in ten (69.4 percent) respondents reported a salary increase in 2016, while 29.2 percent said their pay remained the same, and 1.4 percent saw their salaries decrease. These number are comparable to last year’s, though a bit “better,” as more laboratorians saw increases and fewer saw decreases. Looking to 2017, 14.2 percent expect no pay increase in the year ahead, while 48 percent expect a raise of two to four percent. One-fourth of respondents predict their raise will be less than two percent, and 1.8 percent think it will be a five percent raise or higher. About one-tenth of respondents say they “don’t know” whether they will receive a pay increase.
In the clinical laboratory as in most workplaces, benefits continue to be part of employees “hidden” salaries, and there is anecdotal evidence that suggests many employees are more concerned with keeping benefits than getting nominal pay increases. 97.9 percent of survey respondents receive health insurance through their employer, and 92.6 percent have the dental option. Just over 90 percent have a 401k or pension plan, 85.4 percent have life insurance, and 84.6 have vision insurance. Seven in nine respondents (77 percent) have disability insurance. 71.3 percent have paid holiday time, and a little more than one-third receive overtime pay (This is a significant drop from last year, when just over one-half the respondents did.) 22.2 percent of respondents received bonuses last year.
Service and staffing
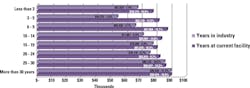
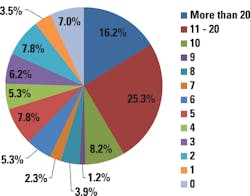
The survey indicates that a large number of laboratorians have been in the industry a long time—but there are also signs of the beginnings of the infusion of new blood that the industry will need. 51.3 percent of respondents have been in the lab workforce for 30 years or more, and another 30.2 percent have had between 20 and 30 years of service. But three percent of respondents have been in the industry for five years or less, and 6.1 percent ten years of less. As retirements loom, those numbers are likely to change.
Just under 40 percent of respondents have worked for their current employer for 20 years or more—a remarkable statistic, when you consider the increasing turnover in most industries today. On the other side of the spectrum, 10.9 percent have been with their current employer three years or less. That is down from 14.2 percent a year ago.
Survey participants who have been in the clinical lab 30 years or more make the most money on average: $90,529. But if you predict that the newest employees—less than three years’ service—make the least, you will be wrong. The three years or less people average $67,929. That’s about $13,500 more than the three-to-five-years group ($54,375), and a shade more than the six-to-9 folks ($66,438). Perhaps new employees are being recruited with higher starting salaries, or maybe they are coming in with better credentials, or both.
How long are the shifts those workers are working? According to the survey, just shy of 60 percent work the standard eight hours but about one in six work nine- or ten-hour shifts.
Certification and continuing education
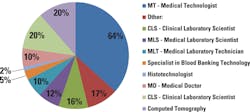
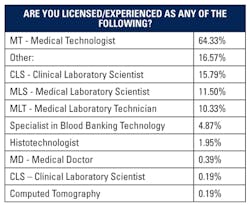
As in past surveys, this year medical technologist (MT) comprises the largest percentage of certifications (64.3 percent). That certification is followed by clinical laboratory scientist (CLS) at 15.8 percent, medical laboratory scientist (MLS) at 11.5 percent, and medical laboratory technician (MLT) at 10.3 percent. Specialists in Blood Banking (SBB) made up 4.9 percent of the respondents.
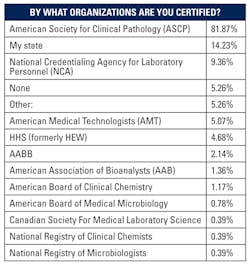
As in the past, also, the heavy majority of survey participants (81.9 percent) received their accreditation through the American Society for Clinical Pathology (ASCP). State certification came in a distant second at 14.2 percent, and the National Credentialing Agency for Laboratory Personnel (NCALP) placed third with 9.4 percent. Of course, many respondents had multiple certifications.
The survey reports that just under half the respondents took ten or more Continuing Education classes (49.7 percent). Only seven percent took no CE classes at all. That is fewer than last year, when the analogous figure was 10.7 percent.
Test volume, automation, and more
How many labs are doing how many tests? More than one-sixth of survey respondents (17.3 percent) work for labs that run more than two million tests a year. Another 21.6 percent of labs represented in the survey run one to two million, and another 16.2 percent run between 500,000 and a million tests a year. Only 5.7 percent of the responding laboratorians checked the box next to the lowest number—less than 25,000 tests run per year.
Automation continues to be, as the saying goes, “the wave of the present.” 50.3 percent of survey respondents indicated that their lab had automated or further automated processes during the last year.
The survey asked respondents to assess the impact that personnel shortages have had on their lab. 27.5 percent answered that staff shortages are having a large impact, 41.5 percent said they are having a moderate impact, and 23.2 percent said they are having a low impact. The moderate and large impact numbers are significantly higher than the numbers reported by the survey a year ago (19.8 percent large, and 36.3 moderate), which suggests that this is becoming a bigger problem—or in any case, is perceived as a bigger problem than it used to be.
Outsourcing is a related topic that is controversial in clinical labs, and a cost vs. benefit issue for many lab directors. Still, only 13.1 percent of respondents said their lab outsourced more tests in 2016—actually a bit lower than the prior year’s 14.7 percent. That may be an indirect measure of pressure on labs to do more with less (staff).
The rise of molecular diagnostics (MDx) and precision medicine is another trend that is greatly affecting the clinical lab. Judging from our survey respondents, molecular diagnostics has certainly made its mark in the microbiology lab: 66.5 percent of respondents say MDx has been embraced by that bench in their lab (as opposed to 57.5 percent last year.) Molecular diagnostics has been slower to make inroads in Chemistry (12.1 percent), Hematology (7 percent) and Blood Bank (3.5 percent).
The happiness factor
How happy are today’s laboratorians on the job? MLO asked the clinical laboratory professionals who responded to the annual salary survey to assess their job security and satisfaction.
Job security—the number of respondents who reported themselves to be either very or somewhat secure in their work—came in at an even 94 percent. Only 1.6 percent said they were “very insecure” in their job.
Job satisfaction—the number of respondents who said they were either very or somewhat satisfied with their work—came in at 88.9 percent. Only 1.8 percent said they were very dissatisfied.
Those numbers are comparable to last year’s—in fact a bit better. Last year, 90.6 percent were either very or somewhat secure, and 85.8 very or somewhat satisfied.
That’s good news. Probably all of the respondents would have agreed if we had asked, “Do you think that these are times of change for healthcare?” and “Do you think that these are challenging times for the clinical lab?” If laboratorians can face the changes and challenges with optimism and confidence, surely the profession will not only survive, but thrive.