March is here, the days are getting longer, the snow is gone or going fast, baseball’s spring training has come to Arizona and (MLO ’s home state) Florida, and here is yet another sure sign of spring: MLO is proud to present the 2016 Annual Salary Survey. Our sincere thanks to all who participated.
Like all surveys, the results of this one are both undeniably useful, and instantly obsolete. They provide a snapshot in time, but time moves on. However, MLO ’s survey, which was filled out by about 400 readers in late January and compiled in early February, is about as up-to-the-minute as any you will find. And comparisons between the 2016 results and the 2015 results are especially valuable, since they are suggestive of trends—or, in many cases, of relative stasis with regard to salary and the other aspects of the profession that are covered by MLO ’s questionnaire.
Summary of the basics
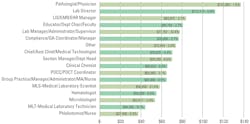
The average salary as reported by the 2016 survey is $71,491; that is a significant decrease from the 2015 survey figure of $80,985. Since most survey respondents did not report a reduction in salary during 2016, that statistic may seem surprising. However, the changes come from the percentage differences in respondent job functions. In 2015, 56 percent of the respondents were Lab Managers (average salary $81,992), and 17 percent Lab Directors, with an average salary of $82,288. This year’s Lab Manager respondents were just 32.4 percent and had an average $77,707 salary. Lab Directors were six percent of the respondents, with an average salary of $112,114—a considerable increase over 2015.
Perhaps the change can also be explained by the gradual entry of young laboratorians, new to the profession, who are beginning to replace retiring laboratorians. Younger cohorts (in terms of ten-year age spans) were more highly represented in this year’s survey, and that may have brought the salary numbers down. Whatever the reason(s), as you will see in what follows, reported salaries were lower by most measures in 2015 than in 2014.
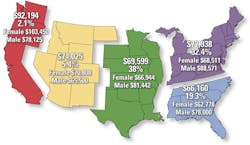
The average salary for a female in the industry is $69,381 ($75,535 in last year’s survey). The average salary for a male is $81,857 ($96,539 last year). There were significant differences in this area among the regions of the United States (see regional map, above).
Nearly three-quarters (74.1 percent) of survey respondents are employed by hospital labs. The largest number of respondents (26.7 percent) are associated with labs that have ten or fewer employees, though almost as high a percentage (24.9 percent) work in labs with 21 to 50 employees.
Another major difference is that 53.5 percent of the respondents told us they were hourly this year versus just 30 percent last year. This could be another factor in the average salary differences, as the hourly employees averaged $57,970 a year while the salaried employees average was $87,032 (46.5 percent). In 2015, only 30 percent were hourly, with average wages of $62,337, and salaried employees (69.7 percent) had salaries of $89,100.
Age distribution and comparison
The highest number of respondents were in the 56-to-65 age group—42.5 percent. This is slightly up from last year’s number, 41.7 percent. 22.2 percent were in the 46-to-55 group, compared to 32.7 percent last year. There was an uptick this year in the number of respondents in the 36-to-45 group—17.1 percent, as opposed to 14 percent last year; and 9.6 percent of the respondents were in the 26-to-35 group, nearly double last year’s five percent. The average age fell two years, from almost 55 in the 2015 survey to almost 53 in this year’s survey.
Salary and education
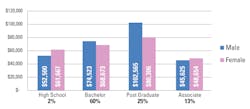
With regard to highest academic degree, 60.2 percent of respondents held a Bachelor’s degree, the same as last year, and their average income was $69,740 ($77,977 last year). 25.1 percent held post-graduate degrees, compared to 30 percent last year, and their salary averaged $88,495 ($83,534 last year). 12.8 percent of surveyed laboratorians held an Associate’s degree, and their salary averaged $48,021. That is more in keeping with common sense than last year’s numbers, which showed Associate degree holders making more on average than Bachelor’s and Master’s degree holders.
Salary by geographic region
- As was the case last year, the Pacific Coastal region comes in as the highest-paying, with an average salary of $92,194 ($103,450 for females, $78,125 for males).
- The average salary in the Mountain states is $74,025 ($70,808 female, $65,500 male).
- In the Central region, the average salary is $69,599 ($66,944 female, $81,442 male).
- In the Northeast, the average is $72,938 ($68,511 female, $88,571 male).
- The Southeast comes in with the lowest average salary, which was also the case last year. This year’s number is $66,160 ($62,778 female, $78,000 male, but had 29 percent more respondents than last year).
Overall, salaries seem to drop as we travel across the nation from west to east, with a little salary recovery in the Northeast. What is genuinely puzzling is that women seem to get paid more than men in the Pacific (by a lot) and in the Mountain (by less) regions, but men’s pay is higher in the other three regions. Are there economic factors east of the Rockies that cause this disparity? The editors would be pleased to hear from readers who might have theories about this surprising finding.
Increases and benefits
Nearly two-thirds (66.3 percent) of respondents reported a salary increase in 2015, while 31.3 percent said their pay remained the same, and 2.4 percent saw their salaries decrease. Looking to 2016, 18.7 percent do not expect a pay increase; 22.5 percent expect a raise of less than two percent; 44.1 percent expect an increase of two to four percent; and 3.2 percent anticipate an increase of five percent or more.
Benefits continue to be an important part of the compensation package for U.S. laboratorians. 97.6 percent have access to health insurance through their employer, and 93 percent have a dental option. 90.4 percent have access to a 401k or pension plan. 77 percent have disability insurance available to them. Childcare is available to 5.6 percent of respondents. All of these numbers are close to last year’s, though some are slightly lower.
52.7 percent of respondents say they received overtime pay—compared to 32.7 percent last year, a notable departure. 12 percent were offered flextime and 23.7 percent received bonuses—both slightly lower than last year.
Length of service
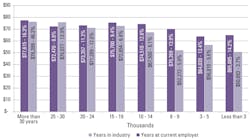
It is still an aging work force, but there seems to be a statistically significant infusion of youth. Nearly half of survey participants—46.3 percent—have been employed in the lab industry for more than 30 years. Another 25.9 percent have served for 20 to 30 years. Nearly ten percent, however, have been in the industry for less than five years. That number was 1.8 percent a year ago.
Just over 36 percent have held a position with their current employer for more than twenty years; 14.2 percent have been with their current employer less than three years. The latter number is up from 10.2 percent a year ago.
Not surprisingly, survey participants who have been in the industry less than three years also report the lowest earnings at $50,893. The biggest earners from this year’s survey are those with the most seniority, 30 years or more. Those employees’ average salary is $76,399. The most junior employees, then, make approximately two-thirds of what the most senior earn. It would indeed appear that the modest-but-meaningful infusion of younger/less experienced personnel is also one of the factors responsible for the drop in average salary.
Continuing education and certification
As in past years, medical technologist (MT) comprises the largest percentage of certifications reported by MLO respondents, at 63 percent. This certification is followed by medical laboratory technician (MLT) at 16.2 percent; medical laboratory scientist (MLS) at 16 percent, and clinical laboratory scientist (CLS) at 11.7 percent.
The strong majority of laboratorians who participated in the survey (82.5 percent) received their certification through the American Society for Clinical Pathology (ASCP); 12.5 percent gained certification from the National Credentialing Agency for Laboratory Personnel (NCALP). Just over ten percent received state certifications.
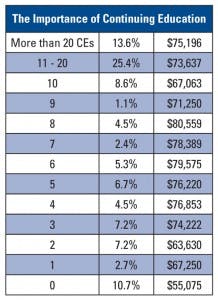
The 2016 survey reports that more than 47.6 percent of lab professionals took ten or more Continuing Education classes annually. Only 10.7 percent did not take at least one over the course of the year. (That last number represents a mild bump over last year’s number, which was 6.7 percent.)
It’s interesting to note that those participants who did not take any CE classes over the last year made the lowest average salary, $55,075. Those who reported taking more than 20 CE classes reported an average annual salary of $75,196.
Automation, personnel shortages, test volumes, outsourcing
Automation continues to change the landscape of the laboratory and how lab professionals do their job—and the pace increased significantly last year, the survey said. 55.9 percent of respondents said their lab automated or increased automation, as opposed to 46.9 percent a year ago. The fact that labs crossed the 50 percent mark with so much room to spare may be an important signal that momentum is on automation’s side.
As in previous years, the 2015 survey asked participants what impact medical personnel shortages have had on their labs. The results were very similar to the 2014 survey. 36.3 percent report a moderate impact, 30.8 percent say low, and 19.8 percent claim a large impact. Only 13.1 percent say personnel shortages had no impact on their lab.
Regarding the important question of test volume: 12.6 percent of responding labs perform more than two million tests annually, and 17.9 percent between one and two million. 19.5 percent perform 500,000 to 1,000,000 tests, and 18.7 percent run 100,000 to 500,000 tests. About 24 percent of responding labs run fewer than 100,000 tests.
In 2014, only 8.2 percent of respondents said their lab outsourced more tests than it had before; that number rose to 14.7 percent in this year’s survey—possibly a sign of the shortage of laboratory personnel.
Security and satisfaction
The bottom line: despite challenges, the clinical laboratory professionals who responded to the 2016 MLO Salary Survey feel very or somewhat secure in their position (90.6 percent) and are very or somewhat satisfied with their job (85.8 percent). Those numbers are comparable to last year’s results.
We hope those numbers continue to be strong—or stronger—in next year’s MLO Salary Survey!
For the sake of comparison: the latest from the OOH
Back in the day, when hard copy was all there was, the Department of Labor’s annual Occupational Outlook Handbook (OOH) used to anchor the office bookshelves of career counselors across the nation. Now that the OOH is available as an online resource, let’s take a look at what it has to say about some current job statistics and the future forecast for “Medical and Clinical Laboratory Technologists and Technicians.” (http://www.bls.gov/ooh/healthcare/medical-and-clinical-laboratory-technologists-and-technicians.htm). The most recent available statistics are from 2014. According to the OOH:
- The median pay for technologists in 2014 was $59,430 annually; the median pay for technicians was $38,370.
- The number of available jobs in the United States was 328,200. That total was almost equally divided between technologist and technician jobs.
- For technologists, about 58 percent of the jobs were in hospitals; 17 percent were in “medical and diagnostic laboratories”; eight percent were in physician offices; and five percent were in academic settings. Median annual salaries were highest for hospital-affiliated technologists ($59,530) and lowest for those affiliated with academic institutions ($53,610). For technicians, 44 percent worked in hospitals, 19 percent in medical and diagnostic laboratories, 12 percent in physician offices, and five percent in academic settings. Median annual salaries were highest for technicians in hospital settings ($39,050), though the variations in pay in the different settings were minimal.
- Annual wages for technologists varied significantly by state, with the Pacific Coastal states, New York, New Jersey, and some states in New England having the highest salaries. California’s annual salary averaged just over $80,000 for technologists.
- The increase in available jobs for 2014-2024 was estimated to be 14 percent for technologists and 18 percent for technicians.
- More than 52,000 jobs (technologists and technicians) were expected to be added during those ten years.

