“Do more with less.”
That’s the message the clinical lab got this past year, either explicitly or by implication—and come to think of it, it’s the same one lab directors have been hearing for a while. Belt-tightening has been the order of the day, and will continue to be.
But so are exciting new assays and approaches, new possibilities in automation, the continuing emergence of molecular diagnostics and personalized medicine, and new quality assurance, reimbursement, and regulatory models that present opportunities as well as challenges for the clinical lab. It is an exciting time for the industry, one of increasing professionalism and vitality.
The 2015 MLO salary survey presents a snapshot of that time, and of the current state of the clinical lab. Like all snapshots, it has limitations, but it captures a moment, providing a picture of the realities of the laboratory profession today and of trends that can be clearly observed and, perhaps, seen coming from a distance. The MLO staff is pleased to present this snapshot to readers. We thank all the laboratory professionals who contributed to this effort by taking the time to answer the survey’s questions.
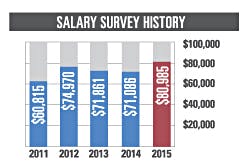
So first, the basics: The average salary as reported by the 2015 survey is $80,985. This represents an increase from the 2014 reported average of $71,086. The average salary of a female in the industry is $75,535, which is 21,004 less than the average male compensation of $96,539.
Just over 69 percent of survey respondents are lab professionals in a hospital lab setting. The largest number of respondents (28.9%) are associated with laboratories with ten or fewer employees, followed by 24.8% who work in labs that employ between 21 and 50.
Age distribution and comparison
The largest percentage of participants in the 2015 MLO salary survey is in the 56-to-65 age group: 41.7%. This is up from 39.7% in the 2014 survey findings. Close behind at 32.7% is the 46-to-55 group; this number is very similar to that of last year’s survey.Respondents aged 26 to 35 continue to comprise a surprisingly small percentage, 5%. Last year saw a doubling of the number of respondents in this cohort, which seemed as though it might herald the beginning of a “youth-ening” of the laboratory community—but the trend has not continued.
In the 2015 survey, laboratorians in the 36-to-45-year-old category make up a relatively small part of the laboratory landscape at 14%, down from last year’s figure of 15.3%. Survey participants age 66 and over continue to claim a small percentage of the pie at 5.5%, about the same as last year’s 5.3%.
Salary and education
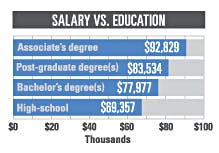
The majority of MLO survey participants (60%) hold a bachelor’s degree, and these laboratorans earn an average of $77,977. Thirty percent hold post-graduate degrees, and their average income is the $83,534. What is of particular interest is the earning power of those with an associate’s degree. Survey respondents with this degree report an average of $92,829. One interpretation comes to mind: high salaries sometimes come to those who work through the ranks within the lab and learn more via on-the-job training than through formal education. We’d be interested to hear if readers have any other explanation for a finding that seems to be counter-intuitive.
Salary by geographic region
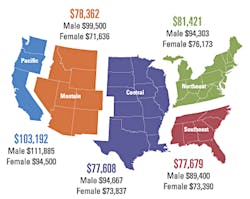
The Pacific region comes in as the highest-paying, with an average income of $103,192. a marked increase from last year’s $88,773. Male lab professionals earn an average of $111,885 in West Coast states; females earn $94,500.
The average salary in the Mountain region is $78,362. Much as in the Pacific region, there is a significant disparity between average male earnings ($99,500) and average female earnings.($71,636).
The average salary in the Central region is $77,608, the lowest by region. There was a marked income discrepancy between the genders, more so than in recent years: Males’ average salary was $94,667, and females’ was $73,837.
The average salary in the Northeast in this survey is $81,421. Men average $94,303, and women average $76,173.
The Southeast comes in with an average of $77,679 in earnings for lab professionals. Women claim an average of $73,390, while their male counterparts report an average of $89,400.
Increases and benefits
Of the respondents, 64.4% report a salary increase in 2014, while 33.8% say their compensation stayed the same and 1.7% report a decrease. A large plurality of survey participants, 43.7% anticipates a salary increase of between two and four percent in 2015. 25.9% expect an increase of less than 2%. Only 1.8% foresee a pay increase of five to seven percent or more.
The “hidden money” available in laboratorians’ paychecks saw some movement in both directions from the 2014 survey to the 2015 survey. Respondents report the following benefits this year: 98.5% have access to health insurance, which is down slightly from last year’s 100%; 93.3% have the option of dental insurance, down from 2014’s 95.6%; 92.7% can opt into a 401k or pension plan, which is up a bit from the 91.1% reported in the previous survey, This year, 88.9% of respondents say they have life insurance; 81.6% have disability insurance available to them, an increase from last year’s 79.4%. Childcare is available to 4.7%, a drop from last year’s figure of 7.1%. Last year’s survey indicated an across-the-board increase in benefits; this year’s survey reflects both upward and downward trends.
Survey respondents also report that 32.7% receive overtime pay, 15.5% can take advantage of flextime, and 28% received bonuses. The percentage receiving overtime pay decreased from 48.8% in last year’s survey; flextime saw an increase from 13.7% in 2014; bonuses increased from 18%.
The 69.7% of survey respondents who are salaried employees earn on average $89,100; their colleagues who are paid on an hourly basis report earnings averaging $62,337. The majority of shift workers, 53.6%, conduct eight-hour work days. (As in last year’s survey, we would like to add a disclaimer on this point: We cannot verify that all of those hourly lab professionals are working the same amount of hours as their salaried peers.)
Length of service
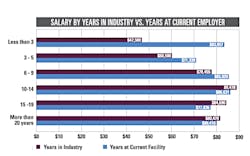
Some 80.2% of survey participants, four out of five, have been employed in the lab industry for more than 20 years. Only 1.5% have been in the lab industry for three to five years. (Was that period of 2009-2011, a time of economic stress in the United States, one of significantly reduced hiring—or perhaps many delayed retirements?) 38.5% have held a position with their current employer for more than twenty years; 10.2% have been with their current employer less than three years.
Not surprisingly, survey participants who have been in the industry less than three years also report the lowest earnings at $47,500. The biggest earners from this year’s survey are those falling into the 10-to-14 years of service category, at $89,478.
The majority of respondents, 56.3%, say that their job function is that of lab manager/administrator/supervisor. 22.2% supervise five or fewer employees.
Continuing education and certification
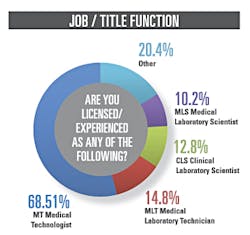
Medical technologists (MT) comprise the largest percentage of certifications reported by MLO respondents, at 68.5%, followed by medical laboratory technicians (MLT) at 14.9%; clinical laboratory scientists (CLS) at 12.8%, and medical laboratory scientists (MLS) at 10.2%.
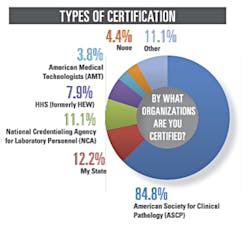
As in past years, the majority of laboratorians who participated in the survey (84.8%) received their certification through the American Society for Clinical Pathology (ASCP); 11.1% gained certification from the National Credentialing Agency for Laboratory Personnel (NCALP). The 2015 survey confirms the findings of previous years that the ASCP and NCALP are the two certifying organizations most used by laboratorians.
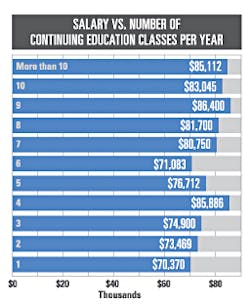
The 2015 survey reports that more than 51% of lab professionals take ten or more Continuing Education classes annually, and only 6.7% do not take at least one over the course of the year.
It’s interesting to note those participants that did not take any CE classes over the last year make the lowest annual salary, $70,370. Showing it pays to take your classes, those who took more than ten classes averaging more than $103,000 inannual salary.
Automation, personnel shortages, test volumes
Automation continues to change the landscape of the laboratory and how lab professionals do their job—but the pace may be slowing just a bit. 53.1% say their lab did not automate new procedures in 2014, as opposed to 50.1% a year ago; 46.9% report that their lab did increase automation in 2014, down from 49.7 % a year ago.
As in previous years, the 2015 survey asked participants what impact medical personnel shortages have had on their labs. The results were very similar to the 2014 survey. 37% report a moderate impact, 33.8% say a low impact, and 17.5% claim a large impact. Only 11.7% say personnel shortages had no impact on their lab.
28.9% of the surveyed community is associated with labs that are performing more than 1,000,000 tests annually. 23% perform 500,000 to 1,000,000 tests, and 26.8% run 100,000 to 500,000 tests. Only about six percent work in labs that run fewer than 25,000 tests.
Outreach efforts
We have heard a lot about outreach over the last year as labs step up efforts to increase their impact in the communities they serve. A question about this trending topic was added to the survey this year. Just over one-third of respondents report that their labs outreach has focused on physician practices, while 14.6% claim that community members have been the primary target of their outreach. Slightly more than four in ten respondents say their lab had minimal outreach in 2014.
Security and satisfaction
The good news from the MLO 2015 salary survey is that lab professionals feel very or somewhat secure in their position and are very or somewhat satisfied with their job: both numbers come in at about 89 percent.
We didn’t ask survey respondents about “Do more with less,” but we suspect most would say, well, it comes with the territory. We are sure that very few dedicated laboratorians would want the reverse—do less with more—but probably a large majority would like to have the chance to “Do more with more.” Let us close with the hope that the larger institutions with which most clinical labs are affiliated will increasingly recognize the value that labs have for the institution and the community they serve, and that budgets will reflect that recognition—and that clinical laboratories will be tasked with the challenge of doing more with more in the years ahead.

