Technological advances in today’s hematology analyzers: how they address common laboratory challenges
Traditional hematology analyzers—and their limitations
Hematology analyzers utilize various technological solutions in order to recognize cell types in a blood sample and to count them individually to generate a complete blood count (CBC) with differential. These solutions include staining internal cellular particles with fluorescent dye and later capturing the emitted light, using enzymatic characteristics of cells such as the presence of myeloperoxidase, and measuring cellular volume by direct current impedance (Coulter Principle). Ultimately, whether using the Coulter Principle or another technology, the data generated is used to plot cells in a histogram. Because cells that belong to the same type will have similar characteristics, they are plotted in the same region of the histogram and form a well-defined population. The analyzer can then count cells in each population, thus generating a complete blood count.
Hematology analyzers are composed of multiple analytical modules which have unique sample preparation processes that allow for the proper counting of the cell type of interest. For instance, in the white blood cell (WBC) module the red blood cells (RBCs) must first be removed by a lysing solution, so that only true WBCs are counted in the final result.
A key challenge of hematology analyzers is discrimination among different cellular elements that fall in similar regions of a histogram, making it difficult to differentiate one from another. For example, a high take off of the WBC histogram can be caused by several elements, such as nucleated red blood cells (nRBCs), giant platelets, platelet clumps, and even intra-cellular parasites from RBCs that get released during the lysing process. In the reticulocyte module, the presence of certain RBC abnormalities such as intra-cellular inclusions increases the laser light scatter of these cells, which end up falling in the reticulocyte population of the histogram and lead to false reticulocytosis being reported by the analyzer. This phenomenon is widely described in literature.1-3 The key challenge presented here, and in several other instances, is that the analyzer has only one histogram per module in which the analyzer can classify cells.
Another key limitation of most analyzers is that data obtained in each module is analyzed independently. Often information from one module can be useful to the detection of interfering particles in another module, but the opportunity is missed because there is no communication between the modules. For example, an elevated mean platelet volume (MPV) can indicate that cellular interference in WBC count was caused by giant platelets. Because of the analyzer’s inability to communicate between modules, technologists in the laboratory are required to interpret this information, which ultimately leads to increased costs and labor, plus an enhanced risk of human error in the process.
Modern hematology analyzers—and their advances
As previously mentioned, some analyzers only have one histogram per module to differentiate cellular elements; however, newer analyzers have the ability to access data from multiple histograms. This is possible in analyzers that incorporate new VCSn technology where in addition to volume and conductivity, several additional cellular measurements can be obtained for each individual cell, including but not limited to five different angles of light scatter and pulse time. This information can be used in multiple combinations to generate dozens of histograms per module, allowing discrimination of different cellular elements.
In hematology analyzers without this technology, the VCS technology was used primarily for generating the differential count. However, in newer analyzers, the enhanced VCSn data is used across all of the analytical modules, such as the differential, reticulocyte and nRBC modules, allowing the instrument to leverage this powerful technology to improve counting and to detect many more important cellular elements and to provide an accurate and precise CBC-diff.
Additionally, some newer analyzers implement algorithms that employ “data fusion” technology, which combines multiple sources of information obtained from separate modules to identify patterns that indicate the presence of cellular elements that could not have been identified with data from only one module. Using data fusion, additional information is available for the identification of interferences so that an automatic correction can be made to the impacted results. In the end, this results in a more accurate result in the first pass, a lower review rate (as samples no longer are flagged for the interfering particle), and labor and cost savings for the laboratory.
Newer technology—and solving cellular interference
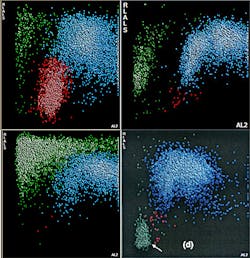
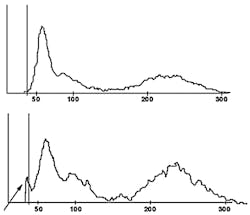
One example of newer technology being employed in the laboratory is in the nRBC count and its discrimination of different causes of cellular interference in the WBC count. Some analyzers now offer several additional histograms that are generated by two of the new angles of light scatter. Axial light loss (AL2) is light absorbance by the cell at an angle of 0 to 0.5 degrees. Low angle light scatter (RLALS) is the light received by a photo sensor placed at an angle of approximately five degrees in relation to the laser beam. This histogram, depicted in Figure 1, is used for the routine reporting of nRBCs as part of the differential count. However, this histogram can also be used to discriminate among four common causes of cellular interference in the WBC chamber: (1) nRBCs; (2) giant platelets; (3) platelet clumps; and (4) intra-cellular parasites. In a traditional WBC histogram all of these particles lead to the same pattern (a high take-off of the WBC curve at the 35fL cutoff point, as is visible in Figure 2.) As is evident, analyzers without this newer technology cannot determine which one is causing the interference. By comparison, in the new AL2 x RLALS histogram, each of the four interfering particles has a different signature pattern.
In this example, it is apparent that data fusion technology can lead to reduced review rate and accurate correction of interfering elements. As was mentioned earlier, some newer analyzers incorporate algorithms that can use data from different modules, referred to as data fusion. One example of how data fusion technology can improve instrument performance is in a sample with giant platelets, which, if larger than 35fL, can lead to false leukocytosis and cellular interference flags. Using data fusion, some analyzers can recognize the presence of giant platelets using information obtained from the platelet measurement and from the NRBC module. This information can be used by the WBC algorithm to correlate with any interference detected, so that applicable automated correction of the WBC count can occur, if required.
In analyzers that do not employ this technology, a sample like this would be flagged for cellular interference and would require the manual labor of sample review and the proper recognition of giant platelets by an experienced technologist who would also manually correct the WBC count. With data fusion technology, these steps now occur automatically at the time of analysis, so that the sample is not flagged for cellular interference—allowing for a reduced laboratory review rate and resulting in an accurately reported WBC count, despite the presence of giant platelets.
Building a better CBC
Peer-reviewed articles published in laboratory medicine literature have confirmed the positive impact that these technological advances bring to laboratories. In two studies evaluating overall flagging performance, published by George et al, Stanford University, analyzers with these newer technologies demonstrated a lower review rate and higher specificity, and yet maintained the same sensitivity as other analyzers.4-6 Of these studies, one included adult samples, and the other was restricted to pediatric and neonatal samples. Of particular interest in the studies was a significantly higher sensitivity for blasts in the adult study, and a significantly better correlation coefficient between instrument and manual nRBC counts in the pediatric study.
In summary, technological advances being incorporated into hematology analyzers today are allowing the laboratorian access to more cellular information than was ever available before through a simple routine CBC with differential. This new information can be used to improve cellular counting and decrease the rate of unnecessary manual reviews. Current research is beginning to demonstrate that this information also has great potential to identify cellular changes that typically occur in several important medical conditions—bringing us all one step closer to using hematology analyzers as more than simple cell counters, but instead as powerful tools for the management of any medical condition that impacts blood cells. The use of these technologies, while often invisible to the operator, can translate into a smoother workflow for the laboratory and an improved diagnostic quality of care for patients.
References
- Sato S, Hirayama K, Koyama A, Harano T, Nagasawa T, Ninomiya H. Pseudoreticulocytosis in a patient with hemoglobin Köln due to autofluorescent erythrocytes enumerated as reticulocytes by the Cell-Dyn 4000. Lab Hematol. 2004;10(2):65-67.
- Scott CS, Van Zyl D, Ho E, Ruivo L, Kunz D, Coetzer TL. Patterns of pseudo-reticulocytosis in malaria: fluorescent analysis with the Cell-Dyn CD4000. Clin Lab Haematol. 2002;24(1):15-20.
- Hoffmann JJ, Pennings JM. Pseudo-reticulocytosis as a result of malaria parasites. Clin Lab Haematol. 1999;21(4):257-260.
- Tan BT, Nava AJ, George TI. Evaluation of the Beckman Coulter UniCel DxH 800, Beckman Coulter LH 780, and Abbott Diagnostics Cell-Dyn Sapphire hematology analyzers on adult specimens in a tertiary care hospital. Am J Clin Pathol. 2011;135(6):939-951.
- Tan BT, Nava AJ, George TI. Evaluation of the Beckman Coulter UniCel DxH 800 and Abbott Diagnostics Cell-Dyn Sapphire hematology analyzers on pediatric and neonatal specimens in a tertiary care hospital. Am J Clin Pathol. 2011;135(6):929-938.
- Kwon MJ, Nam MH, Kim SH, et al. Evaluation of the nucleated red blood cell count in neonates using the Beckman Coulter UniCel DxH 800 analyzer. Int J Lab Hematol. 2011;33(6):620-628.


