Originally, bar codes were linear and consisted of a
series of parallel lines of varying widths. The parallel lines encoded data
and were read by a laser optical device known as a scanner or reader. Using
the UPC bar-code form first took commercial hold in grocery stores,
department stores, and other mass merchandisers. Gradually, the technology
was adopted by other industries and migrated into hospitals and laboratories
where utilizing bar codes, such as Code 128, ISBT 128, Code 39, or
Interleaved 2 of 5, became commonplace. Today, bar-code labels are critical
to laboratory operations where essential patient accessioning, clinical
testing, or research functions occur.
Currently, the buzz in the industry is about the growing
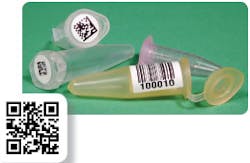
ascendency of 2D bar codes in the United States and Japan. A 2D bar code is
non-linear and consists of black-and-white “cells” or “modules” arranged in
a matrix pattern — typically a square — which, in turn, encapsulates a
“finder” pattern and a “reader” pattern. A 2D, or two-dimensional, bar code
can store a staggering amount of raw data in a very small space. Hospitals
can capture and store a wealth of confidential information with ease (e.g.,
patient name, date of birth, known allergies, current medications, hospital
room number, blood type, lab accession number, phlebotomy test orders,
complete sample profiles, X-ray/CT scan orders and results, health
insurance/billing information).
Any and all information entered into a laboratory or
hospital information system (LIS or HIS) database can find its way into the
2D symbol through connectivity with bar-code design-and-printing software.
In short, with 2D bar coding, every bit of information relating to
point-of-care or hospital protocol can be stored in a tiny symbol that is 2
mm to 3 mm square. 2D bar codes are capacious enough to store thousands of
characters.
2D symbology also offers an especially advantageous
feature for laboratories and hospitals: It is not as susceptible to printing
defects or errors as traditional 1D bar codes. The coding pattern has a high
level of redundancy, with the data dispersed in several locations throughout
the symbology. This enables the bar code to be scanned correctly, even if a
portion of the bar code has printed lightly or is missing altogether.
Whether contracting with a label manufacturer to print labels or printing
the labels on-site, specifying a symbology is necessary. The most popular 2D
bar codes are Data Matrix and QR Code.
Specialized equipment is required to print 2D bar codes.
While they can be printed on laser or inkjet printers, neither is the best
technology for producing specialty laboratory labels. Because laser printers
use heat and pressure for printing office correspondence and similar
business applications, they are limited as to how aggressive the adhesives
or how resistant the media can be to extreme chemicals or temperature
conditions. The best solution is a direct thermal or thermal transfer
printer, both widely available. Look for a brand that offers small, desktop
units engineered to print labels reliably and flexibly. Manufacturers
include Zebra Technologies, Datamax, Intermec, and Sato.
Next, consider the appropriate bar-code
design-and-printing software — particularly a product that is ODBC-compliant
(i.e., open database connectivity), a feature imperative for connection to
LIS or HIS databases. Look for a software program that is versatile;
powerful; intuitively easy to use; and that handles text, bar codes,
human-readable numbers, and even graphics with ease. Another software
feature to consider carefully is a “security center” application to ensure
that ill-intentioned — or even well-intentioned — users cannot change
the label design or label data. This feature provides secure record-keeping
functions for label printing. Software choices include BarTender, NiceLabel,
and Loftware Label Manager.
2D symbologies cannot be read by a laser scanner; they
must be scanned by an image-based scanner employing a charge-coupled device,
or CCD, or some other digital-camera sensor technology. The latter utilize a
small video camera to capture an image of the bar code. The bar-code reader
then uses sophisticated digital image-processing techniques to decode the
symbology. Reading rates of five symbols per second are typical, at
distances ranging from immediate contact to 36 inches away, depending on the
size of the 2D code.
Plenty of choices for these devices exist, including
Motorola/Symbol, Datalogic, Metrologic, Opticon, and Honeywell, among
others. Although costs are falling rapidly, superior 2D still costs a bit
more than other types of bar-code technology. Yet, in terms of speed and
accuracy, the investment is well worth the additional dollars. For example,
these laser scanners have the capability to read traditional 1D symbologies
as well 2D — so, medical facilities still using linear bar-code labels can
make that investment if they need to replace current scanners for any
reason.
As part of the initial start-up costs, consider investing
in a wireless 2D scanner. This enables lab technicians to move
unimpeded from computer to workbench to refrigeration unit — saving time and
improving efficiency. For the ultimate freedom in wireless scanning, check
out the Bluetooth-enabled 2D scanners.
Other advantages for laboratories and hospitals are that
smaller bar codes mean smaller labels engineered from chemical-resistant and
cryogenic materials — both of which are costly and many of which are
proprietary. Bar-coded labels are “safer” for patients in terms of
anonymity, accuracy, and elimination of human error. Handwritten labels can
be difficult to read and/or transcription errors on them have been
commonplace — even catastrophic — in the past. With 2D bar-coded labels,
such mistakes virtually vanish from the workplace.
Additionally, lab technicians are freed from
time-consuming administrative chores. 2D symbols are omnidirectionally
scannable — upside down, backward or forward, and even diagonally — making
them the ideal choice in a hectic or cramped laboratory environment. 2D bar
codes have an added benefit in terms of labeling caps, microvials,
microtiter plates, cryotubes, cassettes, slides, and medical instruments
with nominal “invasion” of space and minimal obstruction to viewing
contents.
For the laboratory scientist engaged in complex processes
— such as aliquoting, precipitation, and purification of samples — the 2D
bar code can encode new data at every step of the process and is backward
traceable for historical-verification purposes.
Mary Hattie of Electronic Imaging Materials Inc. (EIMINC)
is now working on the company's new monthly e-mail newsletter which launches
this month. Founded in 1987, EIMINC (www.barcode-labels.com)
is headquartered in New Hampshire.
CAP's bar-code campaign: a good reminder
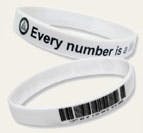
Every day, millions of people rely on healthcare providers.To remind all healthcare professionals that what they do every
day impacts patient lives, the CAP slogan, “Every number is a life,” is
stamped onto white wristbands pictured here. Laboratories can purchase
quantities of the wristbands and posters by downloading an order form
from the CAP micro site:
www.cap.org/apps/docs/proficiency_testing/EveryNumber/index.html .
Laboratory professionals know patients through the
bar code received with a requisition and through specimens delivered to
the lab. They see bar codes, results, and statistics rather than the
faces of the patients they serve. The bracelet reminds them that these
numbers represent sons, daughters, mothers, fathers, sisters, brothers,
and others.


