Digital influenza surveillance enters the laboratory

Influenza viruses cause a substantial burden of illness each year in the United States, estimated at 9.2 to 35.6 million cases of infection, 4.3 to 16.7 million clinic visits, 140,000 to 710,000 hospitalizations, and 12,000 to 56,000 deaths annually.1 We are coming off a particularly aggressive influenza season, with peak percentage of outpatient visits for influenza-like illness (ILI) at the third-highest recorded since 1997-98. Mortality attributed to pneumonia and influenza peaked at 10.8 percent, the highest percentage reported since the 2014-15 season, and included the most reported pediatric deaths (171) since the 2012-13 season.21 The hospitalization rate for laboratory-confirmed influenza for all ages combined was the highest documented in twelve years.2 The overall costs will likely range from $50 to 87 billion when economic analyses for the past influenza season are completed.3
Influenza surveillance and the CDC
Given the magnitude of this challenge, influenza surveillance plays a vital role across the healthcare landscape, including hospitals, clinics, urgent care centers, and laboratories, where its benefits include:
- Aiding healthcare and laboratory administrators to predict surge demand
- Promoting timely vaccination campaigns
- Facilitating hospital and laboratory human resource planning
- Enabling alerts and educational notices for the healthcare community, patients, and public
- Stimulating pharmacy resource planning and allocations.
The U.S. Centers for Disease Control and Surveillance (CDC) developed its first surveillance program nearly 70 years ago,4 and today it has expanded to cover many infectious diseases. Confronted with influenza epidemics annually, the agency must monitor these constantly changing viruses throughout the year, and in collaboration with public health partners and diagnostic laboratories, the CDC collects and analyzes data from multiple surveillance systems to determine when, where, and what viruses are circulating.5 These efforts track currently circulating influenza viruses, identify novel influenza viruses of public health importance, monitor antiviral drug susceptibility, and characterize circulating seasonal viruses for guiding influenza vaccine virus selection and production.5 The CDC communicates this and a wealth of additional information to nationwide public health officials, clinical laboratory management, physicians, hospital administrators, pharmacy chains, antiviral manufacturers, and the public each year.
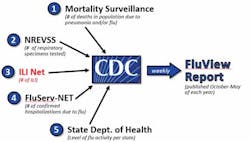
Timely and effective communication is key, and it is always a challenge.6 The current CDC program has five principle categories for influenza surveillance.5 (Figure 1)
CDC’s ILINet surveillance category
The U.S. Outpatient Influenza-like Illness Surveillance Network (ILINet) arm compiles weekly reports from more than 2,800 healthcare providers on the total number of physician visits and number of these visits associated with an ILI, defined as fever and cough and/or sore throat without an identified cause (other than influenza).5 During the 2017-18 influenza season alone, ILINet compiled data for more than 1.1 million patients with ILI among nearly 34 million patients evaluated in outpatient clinics across the U.S.7 This (and the CDC’s other surveillance arms) has provided remarkable benefit to the nation and constitutes a prime feature of the FluView Reports that the CDC issues weekly during the influenza season from October to May.
Despite its undeniable merits, however, ILINet has shortcomings, too:
- The fact that contributions from sentinel sites are voluntary, often delayed, or incomplete
- Reporting delays that often extend to two weeks, and are often revised weeks later as additional results become available8
- Heavy reliance on clinical criteria alone (limited specificity; many respiratory conditions mimic symptoms of influenza infection)9
- Variability in clinical knowledge, background, and experience among outpatient care centers.10
CDC’s nondigital laboratory-based surveillance
Understanding the shortcomings of surveillance methods based largely on clinical criteria alone, the CDC has begun to collect and analyze laboratory data from a variety of sources. The U.S. World Health Organization Collaborating Laboratories System, in conjunction with the National Respiratory and Enteric Virus Surveillance System (WHO/NREVSS), collects weekly records of the numbers and results of diagnostic tests for influenza from approximately 100 public health laboratories and 300 additional clinical laboratories representing all fifty states. During the 2017-18 influenza season, nearly 1.2 million test results were submitted by WHO/NREVSS laboratories.11 These efforts have highlighted a path for improved and more accurate influenza surveillance and prompted additional undertakings.
The CDC is now working diligently with state public health agencies and other laboratories to seek and incorporate more laboratory data directly into its evolving surveillance program. With advances in both molecular assays and rapid antigen detection tests (RADT) (including new FDA standards for RADT performance12), time to result and clinical accuracy may be improved, and, with expanding data procurement from clinical and state laboratories, the needed analyses may be executed more quickly and efficiently and with greater precision. In turn, this developing program should provide a more reliable estimation of the prevalence and magnitude of illness in a community than have previous efforts.
However, deficiencies remain in these approaches as well:
- There is a lack of standardized testing method(s) or reporting structure due to variability in state regulations
- There is variability in testing methodologies among participating laboratories.
- Eight states are not presently participating.
- Technology costs and resource allocation present challenges to many laboratories and public health entities.
- Reporting delays still occur, usually one week.
- Insufficient state and federal budgets impede implementation.
Nonlaboratory digital surveillance
Given some of the acknowledged deficiencies of current surveillance systems, especially in the timely delivery of data, efforts to use digital technology to alleviate or overcome some of the continuing challenges have evolved. Five basic categories have been identified,13-16 four of which are nonlaboratory-based: participatory surveillance systems; internet news data systems; search query systems; and social media systems. To varying extents, these systems rely heavily on non-standardized information originating in nonlaboratory settings. They involve the capture and use of information from the internet that is based on single messages, word queries, references in news bulletins, self-assessment of illness by members of the public, and comments on social media platforms. Such data are potentially unreliable.
Several such entities are currently in use. In an effort to improve their specificity and overall accuracy,17,18 some supplement their data and conclusions with publically available information that is provided by FluView and other state and county public health agencies. Despite their handicaps, these non-laboratory digital surveillance systems hold promise to provide meaningful contributions to the nation’s influenza surveillance as system capabilities and fail-safe mechanisms advance.
Instrument-based digital surveillance
The fifth digitally-based surveillance system pertains to diagnostic instrument-based systems, an increasing number of which are used in diagnostic laboratories across the nation. Different diagnostic companies are introducing diagnostic instruments with their own versions of digital or wireless surveillance, including the transmission of influenza results through the LIS systems in medical centers and hospitals.19,20 Other systems feature the wireless transmission of test results to clouds for subsequent analysis and deployment to public health or participating healthcare facilities. Notably, these functions are outside the control or guidance of the CDC and other public health agencies, but they are capable of addressing some of the shortcomings of existing efforts by public health and other digital systems mentioned above.
Transmittable data, depending on source, may include positive and negative test results, names of operators, precise instrument locations, QC results, instrument calibration results, regional trends, and comparisons of results from different facilities in the same or different geographic or demographic settings. These data enable trend comparisons by period (week, month, and year) and can serve to help laboratory managers anticipate labor and test kit needs and other materials required for their operations. Results are generally transmitted in near real-time within seconds or minutes. Transmitted results are HIPAA-compliant and are untraceable back to the patient. Providing all test results in near real-time, these instrument-based systems overcome the major shortcoming of ILINet and other public health efforts. Their results are timely and comprehensive and give a reliable indication of disease prevalence in a region, as both positive and negative results are transmitted. In turn, near real-time data and subsequent analysis allow for expedited response by public health officials in the midst of a rapidly evolving respiratory season.
Some systems also provide pre-programmed analyses available to laboratory staff immediately upon accessing. Recently, some systems have been modified to automatically forward QC results and/or regional and national test results on a frequent basis; this automatic delivery of near real-time surveillance (updates available on a daily basis) greatly enhances their utility and appeal to healthcare stakeholders, including laboratory management and staff, physicians, and hospital administrators. Some digital systems now include activity maps, providing the locations from which influenza results are emanating, the magnitude of testing, and the percentage of positive test results—that is, a direct indication of regional disease prevalence.
Like all surveillance systems, these also have their shortcomings: Many lack comprehensive geographic coverage (dependent on commercial placements); any variability in clinical knowledge, background, policy, and experience at outpatient and/or point-of-care centers may affect testing patterns9; the reliability of results depends on the clinical accuracy and performance capabilities of commercial tests being used; the reliability also depends on adherence to assay procedure by operators. Additionally, although these systems provide great value for assessment of disease spread, prevalence, and potentially even severity, they do not necessarily facilitate the delivery of specimens to public health agencies for characterization of circulating influenza strains.
Evolution of influenza surveillance
Given advancing efforts to develop and deploy instrument-based digital systems (including molecular and immunoassay systems) which may be integrated into current and future surveillance programs, industry is likely to work with public health and other government agencies in the future to help provide an overall benefit to the public. Ease of use and reliability of this technology will continue to improve. With expanding geographic coverage, such comprehensive real-time data could have a profound effect on epidemiology research in general and, importantly, could impact the efforts of computational biologists and sophisticated statisticians to forecast influenza activity and severity.21,22 As advanced computational methods on high-capacity computers become more broadly available,14,23 it seems likely that hybrid systems will be developed that will use digitally-based big-data from diverse sources and exploit the unique advantages of each system.24 Instrument-based systems employed in laboratories will be a key element in such efforts.
The need for influenza surveillance has driven much of the development of these digital systems. Given the rapid advances in development and application of these platforms, it is very likely that such systems will be applied to other infectious diseases, especially those with seasonal features like RSV, group A strep, and Lyme disease.
REFERENCES
- Centers for Disease Control and Prevention: Disease burden of influenza. 2018
- Garten R, Blanton L, Elal AIA, et al. Update: influenza activity in the united states during the 2017-18 season and composition of the 2018-19 influenza vaccine. MMWR 2018;67(22):634-642.
- Molinari NA, Ortega-Sanchez IR, Messonnier ML, et al. The annual impact of seasonal influenza in the US: measuring disease burden and costs. Vaccine. 2007;25(27):5086-5096.
- Foege WH. Alexander D. Langmuir—his impact on public health. Am J Epidemiol. 1996;144(8 Suppl):S11-15.
- Centers for Disease Control and Prevention: Overview of influenza surveillance in the United States. 2018
- Temte JL, Barlow S, Schemmel A, et al. New method for real time influenza surveillance in primary care: a Wisconsin Research and Education Network (WREN) supported study. J Am Board Fam Med. 2017;30(5):615-623.
- Centers for Disease Control and Prevention: FluView: United States Outpatient Influenza-like Illness Surveillance Network (ILINet). 2018
- Paul MJ, Dredze M, Broniatowski D. Twitter improves influenza forecasting. PLoS Curr. 2014;6.
- May L, Chretien JP, Pavlin JA. Beyond traditional surveillance: applying syndromic surveillance to developing settings—opportunities and challenges. BMC Public Health. 2009;9:242.
- Jester B, Schwerzmann J, Mustaquim D, et al. Mapping of the U.S. domestic influenza virologic surveillance landscape. Emerg Infect Dis. 2018;24(7).
- Centers for Disease Control and Prevention: FluView: United States/World Health Organization Collaborating Laboratories System or the National Respiratory and Enteric Virus Surveillance System (WHO/NREVSS). 2018.
- Administration FaD. Microbiology Devices. Reclassification of influenza virus antigen detection test systems intended for use directly with clinical specimens. 2017;
- Nsoesie EO, Brownstein JS. Computational approaches to influenza surveillance: beyond timeliness. Cell Host Microbe. 2015;17(3):275-278.
- Richards CL, Iademarco MF, Atkinson D, et al. Advances in public health surveillance and information dissemination at the Centers for Disease Control and Prevention. Public Health Rep. 2017;132(4):403-410.
- Santillana M, Nguyen AT, Dredze M, Paul MJ, Nsoesie EO, Brownstein JS. Combining search, social media, and traditional data sources to improve influenza surveillance. PLoS Comput Biol. 2015;11(10):e1004513.
- Schmidt CW. Trending now: using social media to predict and track disease outbreaks. Environ Health Perspect. 2012;120(1):A30-33.
- Ginsberg J, Mohebbi MH, Patel RS, Brammer L, Smolinski MS, Brilliant L. Detecting influenza epidemics using search engine query data. Nature. 2009;457(7232):1012-1014.
- Polgreen PM, Chen Y, Pennock DM, Nelson FD. Using internet searches for influenza surveillance. Clin Infect Dis. 2008;47(11):1443-1448.
- Meyers L, Ginocchio CC, Faucett AN, et al. Automated collection of pathogen-specific diagnostic data for real-time syndromic epidemiological studies. bioRxiv. 2017.
- Tamerius J, Reddy SK, Steadman J. Near real-time surveillance of disease during 2016-17 influenza season in the U.S. Online Journal of Public Health Informatics. 2018;10(1).
- Biggerstaff M, Alper D, Dredze M, et al. Results from the centers for disease control and prevention’s predict the 2013-2014 Influenza Season Challenge. BMC Infect Dis. 2016;16:357.
- Biggerstaff M, Johansson M, Alper D, et al. Results from the second year of a collaborative effort to forecast influenza seasons in the United States. Epidemics. 2018.
- Hswen Y, Brownstein JS, Liu J, Hawkins JB. Use of a digital health application for influenza surveillance in China. Am J Public Health. 2017;107(7):1130-1136.
- Simonsen L, Gog JR, Olson D, Viboud C. Infectious disease surveillance in the big data era: towards faster and locally relevant systems. J Infect Dis. 2016;214(suppl_4):S380-S385.