Beyond the CBC: Emerging hematology biomarkers and automated technologies transforming clinical laboratory practice
LEARNING OBJECTIVES
-
Describe the major historical developments that led to the evolution of the complete blood count (CBC), including manual and automated cell-counting methods.
-
Explain the principles of electronic cell counting and the impact of the Coulter Principle on modern hematology laboratory practice.
-
Differentiate the clinical applications of extended hematology parameters, including immature granulocyte percentage (IG%), immature platelet fraction (IPF), reticulocyte hemoglobin equivalent (Ret-He), and cell population data (CPD).
-
Identify key cellular, molecular, and technological biomarkers used in the diagnosis, prognosis, and monitoring of hematologic malignancies and related disorders.
To take the test online go HERE. For more information, visit the Continuing Education tab.
For decades, the complete blood count (CBC) has been the cornerstone of clinical hematology — a workhorse panel that guides diagnoses ranging from anemia and infection to leukemia and coagulation disorders. Yet, despite its extraordinary utility, the traditional CBC offers only a partial view of the complex cellular dynamics occurring within the bloodstream. More than 500 million CBCs are performed annually in the United States.1 Even marginal improvements in diagnostic precision carry transformative implications for patient care.
The evolution of the complete blood count
The history of hematologic diagnosis is closely tied to the development of methods for examining and counting blood cells.2
In 1852, German physiologist Karl von Vierordt introduced red blood cell counting. Improvements in counting chambers eventually led to the hemacytometer, which enabled measurement of abnormal red and white blood cell counts for more than a century. In 1879, Paul Ehrlich developed staining techniques that distinguished different leukocytes, establishing the basis for the white cell differential count. His identification of reticulocytes later helped clinicians assess bone marrow function and distinguish impaired red cell production from increased red cell destruction (hemolysis).
In 1885, Swedish physiologists Magnus Blix and Sven Gustaf Hedin developed the “hämatokrit,” an instrument that used centrifugation to measure the packed red cell volume of blood. The concept was reportedly inspired by the “laktokrit,” a technique Swedish dairy farmers used to measure milk fat. Hedin later used the hematocrit to establish normal packed red cell volumes across different ages and sexes.2
Decades later, Maxwell Wintrobe improved the hematocrit tube and expanded its applications to measuring sedimentation rate, packed red cell volume, plasma coloration, and the buffy coat—a crude indicator of white blood cell levels. The Wintrobe method was eventually replaced by the microhematocrit, which required less blood and a small, high-speed centrifuge. Over time, “hematocrit” came to refer to the measurement itself—the packed red cell volume.
Wintrobe also used mean red cell volume to classify and diagnose anemia. Measurements of red cell size and hemoglobin content evolved into the three familiar red cell indices: mean corpuscular volume (MCV), mean corpuscular hemoglobin (MCH), and mean corpuscular hemoglobin concentration (MCHC).2
Early qualitative methods for assessing hemoglobin in clinical settings included the copper sulfate technique (CST). Quantitative methods were later developed including the cyanmethemoglobin method (CM) for assessing hemoglobin concentrations.3 The introduction of the cyanmethemoglobin method provided accurate, reproducible measurement of hemoglobin concentration, while platelet counting improved the assessment of platelet disorders. The CM is the internationally recognized reference method for calibrating clinical and field equipment used to measure hemoglobin and determination of hemoglobin concentration in blood. Yet manual cell counting remained slow, labor-intensive, and prone to error.
The rise of electronic cell counting2
Wallace H. Coulter recognized the inefficiency and lack of high reproducibility of manual blood cell counting and the need for faster, more reproducible blood cell counting. His interest was heightened by the need to assess radiation injury and recovery following the atomic bomb detonations in Japan during the Second World War.
In 1947, Coulter and his brother, Joseph R. Coulter Jr., began developing electronic methods for counting blood cells. Their work led to the Coulter Principle, where particles passing through an aperture carrying an electrical current produce changes in electrical impedance proportional to the particle's volume.
A patent was filed in 1949 and awarded in 1953. The technology provided a faster and more accurate alternative to manual counting. The Model A Coulter Counter was introduced in the mid-1950s, followed by successive improvements. The Model S, introduced in 1968, greatly advanced the speed, accuracy, and ease of blood cell counting and sizing.
As automated analyzers evolved, the CBC expanded beyond traditional measurements to include parameters such as red cell and platelet distribution widths, platelet volume, absolute reticulocyte count, immature granulocytes, nucleated red cells, immature reticulocyte fraction, and reticulocyte hemoglobin content. The Coulter Principle also contributed to the development of flow cytometry, which later incorporated fluorescence and other technologies.
Coulter's work transformed blood cell counting from a tedious manual procedure into rapid, automated analysis, helping revolutionize cytometry, laboratory medicine, and healthcare.
The extended parameters
Modern hematology analyzers now generate a rich array of parameters beyond the standard seven-part differential. Some of the extended parameters are:
Immature granulocyte count (IG%): Immature granulocytes — a collective term for myelocytes, metamyelocytes, and promyelocytes — are precursor white blood cells normally confined to the bone marrow, which are used as a frontline sepsis biomarker.4 Their appearance in peripheral blood reflects an accelerated demand for neutrophil production, classically triggered by bacterial infection or systemic inflammation. Automated hematology analyzers from Sysmex, Beckman Coulter, and Abbott now enumerate these cells as a percentage (IG%) or absolute count (IG#) without additional reagents or manual effort. The diagnostic case for IG% as an early sepsis biomarker is compelling.4 However, IG% is not very specific and is elevated in G-CSF therapy, pregnancy, and stress.
Immature platelet fraction (IPF): Thrombocytopenia — a platelet count below 150 × 10⁹/L — is one of the most common hematological abnormalities encountered in clinical laboratories. Its causes broadly fall into two categories: decreased platelet production (e.g., bone marrow failure, aplastic anemia, myelosuppressive chemotherapy) or increased peripheral destruction (e.g., immune thrombocytopenic purpura [ITP], thrombotic thrombocytopenic purpura [TTP], disseminated intravascular coagulation [DIC]). Distinguishing between these etiologies has historically required bone marrow biopsy or clinical context. The immature platelet fraction (IPF) is changing that paradigm.5
IPF represents the proportion of reticulated platelets — newly released, RNA-containing platelets — relative to the total platelet count. It is a surrogate marker for thrombopoietic activity: when platelet destruction is accelerated (as in ITP), the bone marrow responds by releasing more immature platelets into circulation, elevating the IPF. Conversely, when production is impaired, the IPF is low or normal despite thrombocytopenia.
Reticulocyte hemoglobin equivalent (Ret-He): Anemia affects more than 1.74 billion people worldwide, with iron deficiency anemia (IDA) accounting for the majority of cases. Traditional iron studies — serum ferritin, serum iron, and transferrin saturation — remain the clinical standard, but each has limitations. Ferritin, the most widely used marker, behaves as an acute-phase reactant: It rises during infection, inflammation, and malignancy, masking true iron deficiency in many patients with chronic diseases.
Reticulocyte hemoglobin equivalent (Ret-He) offers a functional alternative. It measures the hemoglobin content of newly formed reticulocytes — the most recently released red blood cells — providing a real-time snapshot of iron availability for erythropoiesis over the preceding 24–48 hours.6,7 Unlike ferritin, Ret-He is not confounded by inflammatory states, making it particularly valuable in patients with chronic kidney disease, cancer, or inflammatory bowel disease.
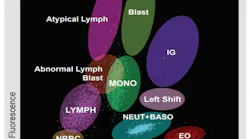
Cell population data (CPD — The CBC's hidden dimension: Every modern hematology analyzer generates far more data than what is displayed on a standard CBC report. Cell population data (CPD) — a group of morphological parameters derived from the scatter and fluorescence signals of individual cells as they pass through the analyzer's flow cell — represent what some researchers call the "cellular fingerprint" of a blood sample at a given moment.8,9
CPD parameters such as NE-SSC (neutrophil side scatter complexity), NE-SFL (neutrophil side fluorescence, related to DNA/RNA content), LY-X, and LY-Y (lymphocyte scatter intensities) reflect subtle changes in cell granularity, size, and nucleic acid content that precede — and sometimes exceed — the diagnostic information conveyed by a standard differential count. A 2024 review in iLABMED summarized mounting evidence for CPD applications across infectious diseases, hematologic malignancies, and inflammatory conditions, noting that MDW (monocyte distribution width), one CPD-derived parameter, is the only one to receive both FDA clearance and CE approval for sepsis screening.
A 2025 study in the Journal of Clinical Laboratory Analysis demonstrated that integrating CPD parameters with WBC-related suspect messages from the analyzer provided a sensitive, automated secondary screening strategy that reduced false negatives in detecting immature white blood cells, enhancing hematologic diagnostic workflows without additional cost.
For clinical laboratory professionals, CPD represents an underutilized resource. Most of this data is currently suppressed in routine reporting. As laboratories and vendors develop interpretive algorithms and machine learning models that can translate CPD signals into actionable clinical flags — for example, detecting blast cells, monitoring inflammatory states, or differentiating viral from bacterial infection — CPD is poised to become one of the most impactful developments in laboratory hematology of the coming decade.
AI-assisted digital morphology: Manual peripheral blood smear review has long been considered the gold standard in hematology — and remains the final arbiter when automated analyzers generate abnormal flags. However, manual differential counting is time-intensive, subject to inter-observer variability, and dependent on the availability of experienced medical laboratory scientists. AI-assisted digital morphology (DM) analyzers are addressing these limitations with measurable impact.
As of late 2023, at least 20 digital morphology platforms are commercially available in clinical hematology workflows, with the FDA having cleared 17 AI-enabled devices for cell analysis. The most widely studied systems — CellaVision DM1200 (CellaVision AB, Lund, Sweden) and Sysmex DI-60 — automatically locate, image, and pre-classify leukocytes, erythrocytes, and platelets from stained peripheral blood smears using deep learning algorithms.10
The laboratory implementation of DM systems requires thoughtful validation. Challenges include variable algorithmic performance for rare and dysplastic cells (such as hypersegmented neutrophils, Pelger-Huët anomaly, and blast variants), the need for laboratory-specific rule sets to determine when manual review remains mandatory, and image quality dependence on smear preparation technique. Standardization of reference images, ongoing proficiency testing of AI classification performance, and robust quality control protocols are essential components of a successful DM implementation.
The expanded CBC: More is not always more1
Even though the modern CBC can contain many parameters, some of which may provide redundant or limited clinical information. Studies of hospital laboratories have found CBCs containing 12 to 24 variables, with most reporting 20 or more. Most CBCs are performed in patients whose diagnosis is already known rather than solely to identify a new hematologic disorder. Focusing the CBC on essential, clinically meaningful measurements — and reducing redundant or low-impact parameters — could improve its utility for physicians.
The evolution of the CBC therefore presents a paradox: Technology has made blood analysis faster, more precise, and more comprehensive, but the next opportunity may be determining which measurements are truly necessary.
Emerging hematology biomarkers
Emerging biomarkers in hematology include molecular, genetic, and cellular indicators that refine the diagnosis, prognosis, and tracking of minimal residual disease (MRD) in blood cancers and disorders.
Cellular biomarkers
CD26 (an enzyme also known as dipeptidylpeptidase, DPP4) is a surface glycoprotein expressed specifically on chronic myeloid leukemia (CML) leukemic stem cells, helps with early detection and MRD monitoring via flow cytometry.11
Detecting CD26 (CD26+) in leukemic stem cells in peripheral blood acts as a rapid, low-cost flow cytometry screen to quickly rule out or confirm a suspicion of CML within an hour, complementing standard cytogenetic and BCR::ABL1 molecular tests.
Molecular biomarkers
Molecular biomarkers in hematology are specific genetic, transcriptomic, or proteomic signatures used to diagnose, classify, prognosticate, and monitor blood disorders and malignancies.
Key molecular biomarkers by disease category
- Myeloid neoplasms
- BCR::ABL1: Pathognomonic translocation for Chronic Myeloid Leukemia (CML) and Philadelphia chromosome-positive Acute Lymphoblastic Leukemia (Ph+ ALL); guides tyrosine kinase inhibitor (TKI) therapy.
- JAK2, CALR, and MPL: Driver mutations found in Myeloproliferative Neoplasms (MPNs) such as polycythemia vera and essential thrombocythemia.
- FLT3, NPM1, and IDH1/2: Critical prognostic and actionable mutation markers in Acute Myeloid Leukemia (AML) that dictate risk stratification and targeted therapy (e.g., menin inhibitors or IDH inhibitors).
- Lymphoid neoplasms
- MYC, BCL2, and BCL6: Rearrangements defining high-risk Non-Hodgkin Lymphomas (such as double-hit lymphomas).
- IKZF1 deletions and CRLF2 alterations: Key high-risk genomic markers in Acute Lymphoblastic Leukemia (ALL).
- CD30 expression / EBV association: Diagnostic hallmarks in Hodgkin Lymphoma.
- Pre-malignant states
- CHIP (clonal hematopoiesis of indeterminate potential): Somatic mutations in epigenetic regulators like DNMT3A, TET2, and ASXL1 that signal an elevated risk for developing overt hematologic cancer or cardiovascular disease.
- Long noncoding RNAs (lncRNAs): Transcripts like BGL3 (acting as a tumor suppressor), MALAT1, and HOTAIR that regulate gene expression and track disease progression or drug resistance.11
- Next-generation gene mutations: Expanded mutational panels (such as FLT3, NPM1, and IDH1/IDH2) that guide targeted therapy choices in acute myeloid leukemia (AML) and other neoplasms.11
- Novel immunotherapy targets: Markers like GPRC5D and BCMA used in multiple myeloma evaluation and guiding specialized cellular treatments.12
Technological approaches for biomarker discovery
Newer technologies have facilitated discovery of new biomarkers for hemato-oncology.
Liquid biopsy: Analyzes circulating tumor DNA (ctDNA) and cell-free components from blood samples to track genomic changes non-invasively.
Single-cell sequencing: Isolates individual cells to map tumor heterogeneity and detect rare resistant clones.
Proteomics: Evaluates the complete set of active proteins in blood or bone marrow matrices to spot functional disease drivers.
Conclusion
Like other branches of medical science, hematology, especially hemato-oncology, are witnessing newer biomarkers and technological development. Moreover, the emergence of automated digital hematopathology, genomic and multi-omics integration, predictive prognostication and generative AI and synthetic cohorts are transforming hematology, especially hemato-oncology, by automating complex diagnostics, predicting treatment responses and enabling hyper-personalized care for blood disorders.
References
- Go LT, Go LT, Gunaratne MDSK, Abeykoon JP. Variation in complete blood count reports across US Hospitals. JAMA Netw Open. 2025 Jun;8(6):e2514050. doi:10.1001/jamanetworkopen.2025.14050.
- Lichtman MA, Burack RW. The evolution of the complete blood count: have we gone too far? Haematologica. 2026;111(4):1215-1219. doi:10.3324/haematol.2025.300032.
- Whitehead RD Jr, Mei Z, Mapango C, Jefferds MED. Methods and analyzers for hemoglobin measurement in clinical laboratories and field settings. Ann N Y Acad Sci. 2019;1450(1):147-171. doi:10.1111/nyas.14124.
- V L, K K, E Y, M S. The clinical utility of automated immature granulocyte masurement in the early diagnosis of bacteremia. Cureus. 2024;16(2):e53660. doi:10.7759/cureus.53660.
- Goel G, Semwal S, Khare A, et al. Immature platelet fraction: Its clinical utility in thrombocytopenia patients. J Lab Physicians. 2021;13(3):214-218. doi:10.1055/s-0041-1729471.
- Rana F, Sinha A, Mishra M, Narayan R. Diagnostic utility of reticulocyte hemoglobin equivalent in iron-deficiency anemia: An observational study from Eastern India. Cureus. 2026;18(1):e101429. doi:10.7759/cureus.101429.
- Tahara S, Naito Y, Okuno K, et al. Clinical utility of reticulocyte hemoglobin equivalent in patients with heart failure. Sci Rep. 2022;12(1):13978. doi:10.1038/s41598-022-18192-x.
- Huang S, Liu Y, Qian L, Zhou J, Wang D. The exploration of cell population data in clinical use: Beyond infectious diseases. iLABMED. 2024;2(2):125-140. doi:10.1002/ila2.41.
- Hsu LC, Tsai TH, Lin YH, Lu KY, Liu WC. Integrating cell population data with hematology analyzer messages for improved detection of immature white blood cells and laboratory efficiency. J Clin Lab Anal. 2025;39(19):e70099. doi:10.1002/jcla.70099.
- Kim H, Hur M, d'Onofrio G, Zini G. Real-world application of digital morphology analyzers: Practical issues and challenges in clinical laboratories. Diagnostics (Basel). 2025;15(6):677. doi:10.3390/diagnostics15060677.
- Golestan A, Zareinejad M, Ramezani A. Comprehensive biomarker profiles in hematological malignancies: improving diagnosis, prognosis, and treatment. Biomark Med. 2025;19(6):223-238. doi:10.1080/17520363.2025.2471745.
- Guinigundo A, Baek G. Staying abreast of new biomarkers in hematology/oncology. J Adv Pract Oncol. 2024;15(3):164-169. doi:10.6004/jadpro.2024.15.3.2.
To take the test online go HERE. For more information, visit the Continuing Education tab.
About the Author
 Rajasri Chandra, MS, MBA
is a global marketing leader with expertise in managing upstream, downstream, strategic, tactical, traditional, and digital marketing in biotech, in vitro diagnostics, life sciences, and pharmaceutical industries. Raj is an orchestrator of go-to-market strategies driving complete product life cycle from ideation to commercialization.
Related
 mlo_graphic_4_of_4