Artificial intelligence in Microbiology for faster actionable results
A staggering 70 percent of medical decisions are impacted by laboratory results.1 In addition to the laboratory’s role of providing timely results to assist diagnosis, other drivers, such as, in Novak and Marlowe’s words, “a global society that has allowed for increased mobility of emerging pathogens and antibiotic-resistant superbugs across continents,2” expand the role of the clinical mcrobiology laboratory. Understanding the laboratory’s role means that quality, traceability, reproducibility, and speed are goals that are always at the top of the clinical microbiology professional’s mind. But in recent years, well documented pressures of increasing work volumes and staff shortages2 are making those important goals even more difficult to reach. Garcia and Fisher have aptly asserted that “one of the challenges in recruiting new highly trained personnel is the lack of recognition for laboratorians in the healthcare environment,3” despite their important contributions to improving patient care.
So, how can laboratorians increase their level of recognition in the healthcare environment? One of the opportunities is to improve turnaround time to results—a challenging goal. Microbiology professionals often recount stories of distressed point-of-care providers urgently requesting STAT culture results. It’s nearly impossible to grow bacteria faster, and with diminishing resources and increased volume, there may not be enough eyes to read plates when they are ready. However, a new technology may be able to help improve turnaround times and patient outcomes, when used in conjunction with the highly specialized analytical skills in the clinical laboratory.
AI in Microbiology
Full laboratory automation in Microbiology is having an impact on laboratories today. It is well established that, despite technical differences in hardware, full microbiology laboratory automation systems available in the market share similar components: specimen processing, track, image acquisitions systems, smart incubation, and workstations.4,5 The key difference in the systems revolves around the strength and technology behind algorithms and the extent of use of artificial intelligence (AI).
In Will Ferrell’s 2003 movie Elf, Buddy explains the elves’ food groups in simple terms: “We elves try to stick to the four main food groups: candy, candy canes, candy corns, and syrup.”6 The use of AI in Microbiology can be similarly grouped and explained in terms of four groups of algorithms: a) chromogenic detection; b) colony counting with growth, no growth discrimination; c) phenotypic colony recognition; and d) application of expert rules. And while AI and algorithms for Microbiology are not a simple matter, the simple explanation provides an outline for the remaining sections of this article.
Chromogenic detection algorithms with 100 percent sensitivity
R. Douglas Scott II, in a report published by the U.S. Centers for Disease Control and Prevention (CDC) titled “The Direct Medical Costs of Healthcare-Associated Infections in U.S. Hospitals and the Benefits of Prevention,” estimates that “the overall annual direct medical costs of HAI to U.S. hospitals ranges from $28.4 to $33.8 billion.7” Using two different Consumer Price Index (CPI) statistics, he also calculated the benefits of prevention, and estimated the benefits to range “from a low of $5.7 to $6.8 billion (20 percent of infections preventable, CPI for all urban consumers) to a high of $25.0 to $31.5 billion (70 percent of infections preventable, CPI for inpatient hospital service).” Active surveillance of HAI infections, such as MRSA, VRE, or ESBL, can aid in the prevention and reduction of HAIs, including its associated costs. Chromogenic media is a common detection method used in surveillance screening programs across the world.8
Two recent multicenter studies used Chromogenic Detection Module algorithms to compare results generated by the software to results generated by the laboratorian: one tested for VRE and one for MRSA. The studies used different manufacturers’ chromogenic media (Figure 1 and Figure 2) and were conducted in different countries. For the 104,730 specimens used in the VRE surveillance study, 100 percent sensitivity was achieved, and the software identified an additional 499 positive results that were missed by the laboratorian.9 There was a 100 percent sensitivity rate in the 57,690 specimens analyzed for the MRSA study, with an additional 158 positive results that were missed by the laboratorian.10
Surveillance cultures are simple, but are seen in high volumes in labs and have a relatively low positivity rate. Factors such as fatigue, high work volume that needs to be processed in a short time, and task repetition could explain the positives that were missed by human eyes. The power of the imaging analysis software in the two studies is that it picked up 100 percent of the positive colonies, and more importantly, identified colonies that the laboratorian called negative by routine visual inspection. Currently, it is important to note that the software cannot be used without human intervention. But the benefit of this new technology is to help the laboratory professionals focus on the positives, by separating the negative results faster with the confidence that thresholds in the software are set to ensure that no true positives are missed.
Colony counting with growth, no growth discrimination
Worldwide, urinary tract infections (UTIs) are one of the most common types of bacterial infections,11 and urine specimens constitute one of the largest volume samples received in the clinical laboratory. The sets of rules for interpreting can be complex, as Faron, Buchan, and colleagues point out, “by several variables, including the presence of small numbers of colonies and the growth of more than one bacterial type.”12 The volume and complexity of urinalysis requires technical expertise and a significant amount of labor from the laboratorian.
Software provided by full lab automation that differentiates negative and non-negative urine cultures on blood and MacConkey plates saves the laboratory time and can reduce turnaround time. In fact, Faron and Buchan’s powerful multi-center study concluded that “current software could improve laboratory workflow by removing 42.2% of urine cultures based on growth less than the laboratories’ threshold.12” The considerable reduction of urine cultures would help laboratories cope with diminishing human resources. Also, the improvement in turnaround time may allow physicians to change the way they prescribe antibiotics for their UTI patients,13 improving antimicrobial stewardship, which is a goal high on the priority list in almost every hospital in the country.
Phenotypic colony recognition and expert rules
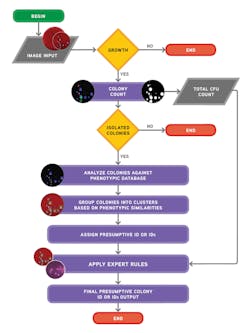
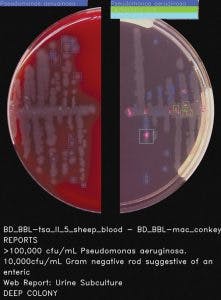
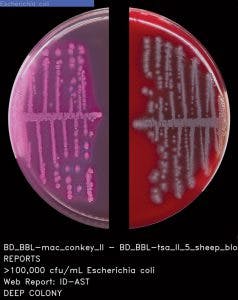
Ideally, the software needs to be able to do both: count colonies and recognize the phenotypic characteristics of the colonies prior to applying user-defined expert rules (Figure 3 and Figure 4). The stepwise approach of the algorithmic process is explained in Figure 5. A recent study presented during 2017 ASM Microbe used the software to count colonies and classify them in category groups for urine samples. It asserted that “expert image analysis software is able to differentiate positive and negative urine cultures with a high sensitivity and negative predictive value. This allows for use as a screening tool to eliminate negative and normal flora and would be an effective mechanism to reduce unnecessary review of negative culture.”14 Once the mathematical colony enumeration and the query through the phenotypical database occurs, the system applies user-defined rules based on the specimen’s source or location and the
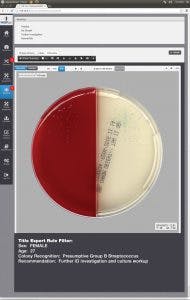
patient’s demographic information. This information is then presented for interpretation. For example, if the sample is a urine, from a female of childbearing age, and there are 10 or more colonies of what appears to be Streptococcus B, even in a mixed culture, the system immediately flags the sample and presents it to the laboratorian for further ID investigation (Figure 6).
The advancement and sophistication of image analysis, through algorithms and AI, is a reality for adopters of full laboratory automation. AI will change the landscape of clinical Microbiology labs in the future. According to Faron, Buchan, and colleagues, some of the benefits of this technology include “decreasing turnaround time, especially in laboratories that are not open 24 hours a day and seven days a week; support of antimicrobial stewardship by allowing pharmacists and physicians to guide practices based on both patient health and laboratory results; and reduction of

laboratory labor costs, as technologists would not have to view any plates with negative results.9” These technological advances will never replace invaluable human skill and expertise. But they promise to help laboratorians improve their recognition in the healthcare environment and cope with the increasing pressure of improving patient outcomes, with increasing volumes, and fewer personnel.
REFERENCES
- Wians FH. Clinical laboratory tests: which, why, and what do the results mean? Lab Med. 2009;40(2):105-113. doi:10.1309/LM4O4L0HHUTWWUDD.
- Novak SM. Marlowe EM. Automation in the clinical microbiology laboratory. Clin Lab Med. 2013;33:567–588.
- Garcia E, Fisher P. The American Society for Clinical Pathology’s 2013 Wage Survey of Clinical Laboratories in the United States. L, 44(4), E97-E115. doi:10.1309/LMWO4E34BQGHZXGM.
- Greub G, Prod’hom G. Automation in clinical bacteriology: what system to choose? Clin Microbiol Infect 2011;17(5):655–660.
- Croxatto A, Prod’hom G, Faverjon F, Rochais Y, Greub G. Laboratory automation in clinical bacteriology: what system to choose? Clin Microbiol Infect. 2016;22(3):217-235.
- Berg J, Komarnicki T, Robertson S, Favreau J. 2003. Elf. USA: Guy Walks Into A Bar Productions.
- Scott RD. The direct medical costs of healthcare-associated infections in U.S.
hospitals and the benefits of prevention. March 2009. https://www.cdc.gov/hai/pdfs/hai/scott_costpaper.pdf. - Calfee D, Salgado C, Milstone A, et al. Strategies to prevent methicillin-resistant Staphylococcus aureus transmission and infection in acute care hospitals: 2014
Update. (2014). Infection Control and Hospital Epidemiology. 2014;35(7):772-796. - Faron M, Buchan B, Coon C, et al. Automatic digital analysis of chromogenic media for vancomycin-resistant Enterococcus screens using Copan WASPLab. J Clin Microbiol. 206; 54(10):2464-2469.
- Faron M, Buchan B, Vismara C, et al. A. Automated scoring of chromogenic media for detection of methicillin-resistant staphylococcus aureus by use of WASPLab image analysis software. J Clin Microbiol. 2016:54(3):620-642.
- Yarbrough ML, Wallace MA, Marshall C, Mathias E, Burnham CD. Culture of urine specimens by use of chromid CPS elite medium can expedite Escherichia coli identification and reduce hands-on time in the clinical laboratory. J Clin Microbiol. 2016;54(11):2767-2773.
- Faron M, Buchan B, Relich R, et al. Use of digital image analysis to interpret urine cultures on blood and MacConkey Agar. 2017 ASM Microbe. New Orleans, LA.
- Richards E, Baker J, Strommen R, Timm K, Culbreath K. Optimization of clinical microbiology laboratory workflow utilizing the COPAN WASPLab™ for urine cultures and MRSA cultures. 2017 ASM Microbe. New Orleans, LA.
- Timm K, Culbreath K. Expert image analysis by COPAN WASPLab™ to evaluate urine cultures. 2017 ASM Microbe. New Orleans, LA.
Gabriela Franco, BS, MIM, serves as COPAN Diagnostics’ Director of Marketing. Gabriela has 15 years of experience in marketing and product management.