Last month’s Primer dealt with endpoint product detection methods for PCR (and similar nucleic acid target amplification strategies), with a primary focus on the agarose gel electrophoresis method. The reader will recall that this had positive features: low costs; simple equipment; ease of interpretation; and capacity to provide two independent pieces of information on a reaction (product presence and size). These were, however, balanced against some serious drawbacks: time; amount of sample handling post-PCR; low throughput; poor amenability to automation; and, most critically, risk of amplicon contamination. This month, we’re going to discuss the first of a class of PCR methods which simultaneously address all of these drawbacks: real-time PCR. (An additional weakness of traditional endpoint-monitored PCR, a lack of ability to be inherently quantitative, is also addressed by real-time methods; however the details of that are both involved enough, and important enough, to warrant their own focused discussion, coming up in the August Primer installment: “Quantitative Molecular Methods.”)
We start by briefly reviewing the phenomenon of fluorescence. This is a process inherent to a material (such as a dye) to absorb photons of light at one wavelength and re-emit them at another wavelength. Because this process can’t contradict the Second Law of Thermodynamics, the emitted photons are always longer wavelength (lower energy, toward red colors) than the absorbed photons (higher energy, toward blue colors). An individual fluorophore—a material which has the property of fluorescence—will have specific, often fairly narrow spectra (or range of colors) which it can absorb, and similarly narrow spectral ranges for emission. Some terms of use in this context are the Stokes shift (the difference between peak absorption and peak emission wavelength/color) and quantum yield (essentially, how efficient the fluorophore is, or what percentage of absorbed photons generate emitted photons).
Fluorescence is a handy tool in many applications, particularly for fluorophores with appreciable Stokes shifts. If a sample containing such a fluorophore is exposed to a narrow spectrum excitation source such as a laser or suitably filtered lamp, and observed through a filter only passing the emitted spectrum, even tiny amounts of fluorescence can be seen by eye or instrumentation. In engineering terms, the signal-to-noise ratio is very high (and generally becomes higher as the Stokes shift is bigger because it is easier to filter out emission from excitation). Finally, many fluorophores are highly sensitive to their environment, with large changes in their quantum yield depending on pH, temperature, and microenvironment, such as exposure to or isolation from water.
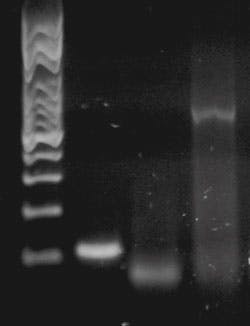
In the May Primer, “Endpoint PCR detection,” we touched on these in the form of dyes added to our agarose gel to stain the DNA bands for visualization. Ethidium bromide is weakly fluorescent when free in water or buffer, but can intercalate (slide between) DNA base pairs in dsDNA; upon doing so, and being isolated from the aqueous environment, it has a large increase in quantum yield. Thus when illuminated with proper exciting light, an ethidium bromide stained gel shows weak fluorescence in general, and very bright fluorescence where DNA is present (in bands; see Figure 1, reproduced from last month’s Primer).
Figure 1. An example of a gel. Lane 1: size standards; Lanes 2, 3, 4: PCR reaction products with different size band
Now imagine we were to set up a generic simple PCR reaction, but include one of these dyes in the reaction mixture. For the sake of argument (and because it is really used for this), let’s say it is SYBR Green I, just as we might use in a gel. Imagine the situation at the start of the reaction, when the only dsDNA present is the tiny amount of template; the total fluorescence of the reaction is small. Now think about it after PCR; if dsDNA were formed (that is, in theory, if the primers successfully found their complementary target sequences and PCR amplification occurred), there’s been a huge increase in the total amount of dsDNA in the tube, and so the dye fluoresces much more strongly. If instead the primers didn’t find their target, and successful amplification didn’t occur, then there’s little or no increase in fluorescence.
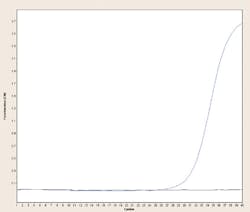
Dye binding based real-time PCR methods make use of the above concepts by making a thermocycler in which every individual reaction tube or well can be illuminated with an appropriate light source (such as laser, filtered incandescent light, or LED) and simultaneously monitored by an optical detector (photomultiplier or photodiode) through an appropriate filter passing the emission wavelength for the dye to be detected. Conveniently, most PCR reaction vessels are made of transparent or translucent plastics or glass, so they’re amenable to allowing light in and out. These types of instruments, known as real-time PCR machines, observe each reaction for fluorescence during the course of each PCR reaction cycle (in “real time”; thus the name). Usually there is some mathematical processing such as background subtraction, or plotting of fluorescence difference from cycle to cycle as opposed to raw signals, or (on some systems) corrections for decay of the fluorophores during the process by normalization to a “passive reference dye,” but, regardless, in the end these methods generate some form of amplification plot which shows whether fluorescence increased during the PCR (amplification occurred) or did not (amplification did not occur). Figure 2 shows one example of each; the positive reaction shows a large sigmoidal curve while the negative reaction remains flat when fluorescence vs. cycle is plotted.
Figure 2. Amplification curves
Let’s stop and consider what this process has done for us, compared to agarose gel endpoint PCR analysis:
- It has saved time, as results are available while the PCR occurs, not some time afterward.
- It has reduced handling, and occurs in a format amenable to automation.
- It has enabled compatibility with automated readout/result calling methods.
- It has greatly reduced risk of amplicon contamination, as the reaction tube never needs to be opened post-amplification.
As promised, most of the problems inherent in gel electrophoresis are solved. The reduction in amplicon contamination risk alone is sufficient to make real-time PCR a wise choice for clinical settings, and real-time versions of assays have replaced agarose gel resolved assays in the large majority of cases where amplicon detection (as opposed to amplicon size) is the basis of the assay.
As described so far however, binding-dye based real-time PCR has one significant disadvantage when compared to agarose gel electrophoresis. Recall that the gel-based method allowed us to confirm both that a product was present, and that it was the predicted size. In the event an assay, for whatever reason, produces spurious product(s), the dye will bind this and produce a signal which can’t be differentiated from a real signal on the basis of amplification curve alone.
The solution to this problem is melt curve analysis. Notice that our binding dyes here are specific for dsDNA; thus, if we have a final end product in our real-time reaction well, and we raise the reaction well temperature, as we cross the Tm for any dsDNA products in the tube, they denature (this was covered in the January 2013 chapter of “The Primer”—“DNA and RNA structure: nucleic acids as genetic material”), and the fluorescent signal arising from dye molecules bound to this product goes away as the dye re-enters the aqueous environment. In general, binding dye based real-time PCR reactions will end with a melt curve step, sweeping across a range of temperatures from perhaps 60°C to 95°C. Fluorescence data from this step is either presented as a raw curve, which in the case of a single product looks much like a pH titration curve for a monoprotic acid (Figure 3); or it may be processed, most commonly with a second derivative function, which graphs as a peak at the inflection point of the raw data.
Figure 3. Melting curves
Figure 4 represents this as done on the same data as Figure 3. Note that the Tm is characteristic for a particular PCR product in a manner analogous to how its length was fixed; thus, observation of a single melt peak at the same temperature as a positive control provides a second independent confirmation that the PCR product observed is the one intended. In the case of a PCR reaction producing (intentionally or unintentionally) more than one product, such as would appear to be two or more bands on an agarose gel, each product will generally have a distinct melting point and the melt curve will appear as a multistep titration, or multiple melt peaks in the case of the second derivative plot (Figure 5). Primer dimer artifacts, such as would appear as a diffuse short molecule smear at the bottom of an agarose gel, similarly tend to appear as a broad, low temperature peak in melt curve analysis and are generally readily distinguished from true products.
Figure 4. Melting peaks
Figure 5. Multiple melt peaks
Three other pieces of very useful information can be obtained from real-time methods which are not possible with endpoint gel-resolved methods.
First, the cycle at which the amplification curve rises out of background noise is related to the starting template concentration; we’ll cover this more in August.
Second, the steepness of the amplification curve is related to the amplification kinetics; well designed assays, which approach the theoretical 2N amplification maximum of PCR, will have steep amplification slopes during the exponential phase, while less efficient assays demonstrate shallower amplification curves. Thus in designing and optimizing a PCR assay, whether it is to be a real-time format or not, analysis of the real-time amplification curve for various assay conditions can help determine best assay conditions.
Finally, careful observation of the melt curve can sometimes be used to detect minor sequence variations within the central portion of the amplicon. An outgrowth of this method, known as “High Resolution Melt” (HRM), uses a specialized subset of dsDNA binding dyes and monitors the post-amplification melt cycle closely for melt curve shape variations which can be used for applications such as heterozygosity detection at characterized loci.
What of our mostly neglected other target molecule, RNA? As RT-PCR starts with conversion of an RNA target to a DNA version and then continues with classical PCR, all of the methods discussed for detection of PCR products (gel, binding dye real time methods in this month’s focus, and next month’s probe-based real-time methods) apply equally well and with little or no changes, short of addition of an initial reverse transcription step and additional care for RNase protection in sample handling.
About the Author

John Brunstein, PhD
is a member of the MLO Editorial Advisory Board. He serves as President and Chief Science Officer for British Columbia-based PathoID, Inc., which provides consulting for development and validation of molecular assays.


