Incorporating Big Data into daily laboratory QC
Common analyzer Quality Control (QC) management and analysis can be difficult, time-consuming, and misleading. With modern technology solutions, however, the laboratory can enhance QC processes, simplify Quality Assurance (QA) management, and change QC/QA trend analysis from a scheduled event to real-time, addressing potential weaknesses in current QC/QA approaches.
How often has a peer IQAP or Proficiency Survey report indicated a test method issue that was not detected by daily QC activity? Has there been a time when a patient “lookback” had to be completed but commercial controls did not detect a change in the test method? Many of these issues might be traced to outdated QC approaches using limited serial number-specific data or practices associated with high false failure rates. Repeating the same control when QC rules are violated without investigation desensitizes staff and limits error detection capabilities.
Common QC recommendations use serial number-specific data to develop daily control rules and targets.1 This leads to analyzers of the same model using the same reagents/controls and same clinical application potentially having significantly different QC quality requirements. We assume they have the same quality goals since each analyzer’s QC rules use the same multiples of serial number-specific standard deviations (SD). It is rare that the true SD values or control target differences are scrutinized immediately between serial numbers to identify and prevent performance issues.
The current, but outdated, practice involves serial number-specific control targets being calculated during lot crossover studies using limited data from 10 to 20 runs of the new QC lot number. Multiplex controls, limited data points, and number of analyzers compound the issue of verifying accurate control target values and balanced error detection limits. The daily QC can only detect immediate problems when the performance goals are set correctly and trending is reviewed frequently.
Big Data steps in
New technology allows changes to existing control processes by incorporating “Big Data” and statistical modeling into daily control processes. It is now possible to develop model- and control parameter-specific target/limit values using hundreds of thousands of data points from large peer groups. This eliminates poor serial number-specific control goals, due to random or systematic errors.
Proficiency Testing (PT) and External Quality Assessment (EQA) programs are small-scale versions of identifying test method performance from peer group data. Since these programs use blind samples analyzed once in the laboratory, the peer data set is small and has limited immediate error-detection capabilities. These programs work well for measuring analyzers’ quality at the point in time of the study, but delayed performance reporting impedes immediate quality improvement efforts or error detection.
Big Data QC expands the concepts of PT and EQA method performance testing into daily control of analyzers. Incorporating modern process-control procedures like Six Sigma to develop model-, parameter-, and concentration-specific performance goals allows for a simplified, but enhanced, QA policy. QC targets and limits built using Big Data allow for minimal control false positives while adding advanced error detection compared to current QC rules using multiples of serial number-specific SDs.
Advanced error detection comes from control target truth using more than 10 to 20 control runs at the start of a lot. The target is based from thousands of results, which eliminates laboratory error or uncertainty related to package insert assay values. Control limits are built from evidence-based methods, specific to that test method, to detect any abnormal change. The evidence-based control limits are optimized for error detection, but with a low false rejection rate to remove the tendency of repeating the same control to resolve failures.
Applying immediate automated pattern analysis from Big Data accurately detects abnormal analyzer recovery, adding to the laboratory’s error detection capabilities. This is a paradigm shift from waiting for scheduled control trending reviews for issue identification; instead, there is automated and immediate detection of test method issues. The automated pattern analysis also removes possible human error in identifying pattern changes and alleviates the difficulty of pattern analysis across control concentration levels.
Big Data-based applications
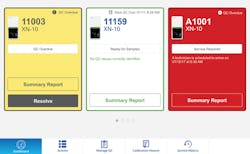
Big Data is the foundation of applications that gather specific data from an instrument and peer model base, evaluate the data in minutes, and provide precise information to the laboratory on the health of the instrument. If an issue is detected, corrective actions with instructions are provided to the laboratory to correct the issue (Figure 1).
This type of technology solution deters bad habits like repeating the same control when recovery is outside of allowable limits by automating analysis of trending and providing corrective actions in line with best practices. The correct action after a control failure is to investigate the cause of the failure and identify whether systematic error or deteriorated control material is the cause.2 Immediate manual investigation of the failed control is not practical in many clinical laboratories, which is why repeating failed controls is the prevailing first corrective action. Simply repeating a failed control can prevent early detection by hiding
systematic error.
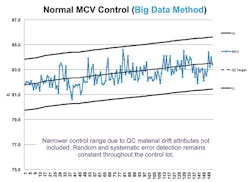
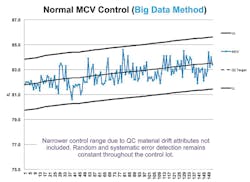
Calculation of control targets using Big Data can also provide solutions to control materials that change or drift over time. Red blood cells (RBCs) in hematology controls are known to change throughout the life of the control lot, affecting the mean corpuscular volume (MCV) (Figure 2). A study by S.J. Kim et al. found MCV drift can exceed 4SD by the fifth week of a control life.3 The study also found that re-establishment of the target mean value frequently might be a solution. The authors note that frequent target mean establishment might be “inefficient as it may considerably increase both the workloads and the expense of the laboratory.”
Using Big Data-based technology removes laboratory inefficiency issues due to systematic errors and laboratory-specific control material deterioration. The amount of data collected can identify true control lot performance and adjust the QC mean target for identified drifting parameters periodically to maintain method control. This allows for reduced control performance goals, since the performance goal would not include control material drift attributes. Control performance goals error detection and false rejection rates remain consistent through the control life, in contrast to the negative control process effects due to control material changes, as documented in the Kim study.
Modernizing control processes using Big Data to remove current weaknesses is not feasible by a single laboratory due to the amount of data required. Benefiting from these new control methods requires partnerships and solutions from instrument or control manufacturers. The laboratory will benefit from simplified processes, reduced expense, and improved patient result accuracy by removing common problems that hinder full commercial control quality monitoring and error detection. Laboratory staff responsible for QA can spend more time in quality improvements and less time in data abstraction.
REFERENCES
- CLSI, Validation, Verification, and Quality Assurance of Automated Hematology Analyzers; Approved Standard H26-A2 June 2010
- Quam EP. QC—the out-of-control problem, Westgard https://www.westgard.com/lesson17full.htm#9
- Kim SJ, Lee EY, Song YJ, Song J, The instability of commercial control materials in quality control of mean corpuscular volume. Clinica Chimica Acta. 2014;Jul 1;434:11-5. doi: 10.1016/j.cca.2014.04.004.
Scott Lesher is an alumnus of the U.S. Army Medical Academy graduate program for biomedical equipment technicians. He has twenty-two years’ experience as a biomedical technician, of which eighteen years were specialized in support of automated hematology analyzers and Quality Control processes. He joined Sysmex in 2007 to manage the assay lab and subsequently moved into his current role as the Director of Quality Assurance.


