Understanding diabetes testing: Where are we, and where are we going?

Diabetes is a prevalent and pressing health concern, affecting 29.1 million people in the United States alone—8.1 million of whom are as-of-yet undiagnosed.1 While people with diabetes make up more than nine percent of the entire U.S. population, the Centers for Disease Control and Prevention (CDC) estimates that 86 million more people have some level of prediabetes,2 meaning they have blood glucose or hemoglobin A1c levels that are elevated but not to the point that they demonstate frank type 2 diabetes. Prediabetes is an increased likelihood of developing diabetes.
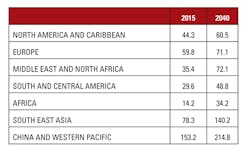
Worldwide, in 2015, there were 415 million people with diabetes. That number is expected to jump to 642 million people by the year 2040. North America, the Caribbean, and Europe will experience incremental growth in diabetes cases during that time, but other regions of the world will see numbers of patients with diabetes more than double (Table 1). A total of $673 billion—12 percent of global health expenditure—is allocated to diabetes.3
Type 1 and type 2
Not everyone with prediabetes will develop diabetes; however, an estimated 15 to 30 percent will develop non-insulin-dependent type 2 diabetes within five years.4 Non-insulin-dependent diabetes was formulated as a category after the discovery, in 1959, that some people with diabetes still produce insulin.5 Insulin-dependent diabetes, originally called “juvenile” diabetes, is categorized as type 1 and manifests with symptoms that are sudden and dramatic.
This distinction between type 1 and type 2 should not be seen as minimizing the health risks associated with type 2 diabetes, once also termed adult onset diabetes. Although the pancreas may produce insulin, the cells may not respond and, over time, the body may, in fact, stop producing insulin altogether. Alarmingly, too, an increasing number of people under 20 are being diagnosed with type 2 diabetes.
Both type 1 and type 2 diabetes carry the risk of significant complications, including heart disease and stroke, retinopathies and blindness, and chronic kidney disease. The poor peripheral circulation often seen in diabetes makes it the leading cause of amputations in many patient populations. Adults with diabetes have a 50 percent higher risk of death than those without diabetes.4 In 2012, $245 billion dollars were spent in the U.S. on both the direct (medical) and indirect (job loss, disability, and premature death) costs related to diabetes. Additionally, people with diabetes spend an average of 2.3 times more on medical care than those without diabetes.6
Successful diabetes management relies on early diagnosis and accurate monitoring. The human and economic toll of this fast-growing, often-undiagnosed health concern has led the medical community to seek testing that offers fast, cost-effective and reliable diagnosis and monitoring for better patient outcomes. The laboratory’s role in the diagnosis of diabetes, as well as evaluation of the type and severity, has become vitally important to the management of the disease, prevention or delay of onset, and prevention of complications. Defining diabetes has shifted to the laboratory, as symptoms alone (excessive thirst, frequent urination) are often not adequate for evaluating the presence or the progression of the disease.
Testing: glycemic control and risk prediction
Predominantly, two testing methods are used to diagnose and monitor diabetes: fasting plasma glucose (FPG or “glucose”) and hemoglobin A1c (HbA1c) testing. Both testing methods have their strengths and weaknesses, and proper understanding of the pros and cons of each enables appropriate application of the right test at the right time for better overall diabetes patient management.
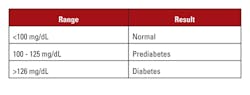
FPG testing measures short-term glucose metabolism, indicating blood glucose levels at a given time. To get an accurate baseline glucose measurement, patients are required to fast at least eight hours prior to the test. Not all patients are compliant. Patients may think if they skip breakfast and only have some orange juice and a little toast, they are still “fasting.” This compromises the reliability of test results. Other factors that can affect results include acute illness, stress, and exercise. An FPG of less than 100 mg/dL is considered normal, while a reading above 126 mg/dL puts a patient in the range for diagnosis of diabetes (Table 2).7
While not ideal for diabetes diagnosis and management, there is a place for non-fasting glucose testing in giving physicians and patients quick results regarding the current blood glucose state. It is most appropriate in managing acute episodes (acute hyperglycemia or hypoglycemia).
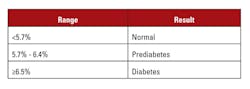
Introduced in the late 1970s, HbA1c testing offers a measurement of longer-term glucose metabolism. As hemoglobin circulates through the body, glucose in the serum reacts with an amino acid group on hemoglobin in proportion to the amount of glucose in the circulation. This glycated hemoglobin, measured as percentage of total hemoglobin, thus serves as an indicator of how much glucose is in the blood. A test result >6.5 percent HbA1c indicates diabetes (Table 3).7
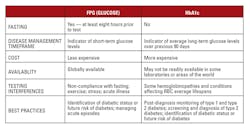
Despite its widespread acceptance and use, HbA1c is not a replacement for FPG testing in managing diabetes. FPG is a measure of short-term glucose levels, while HbA1c is a measure of average long-term glucose levels. Thus, neither is a replacement for the other. Understanding each test, and their potential interferences, ensures proper use and interpretation, which results in more effective patient care (Table 4).
While there are some factors that interfere with FPG testing, interference related to HbA1c testing is more complex. Hemoglobin variants and analytical variables can interfere with HbA1c measurements, as well as the interpretation of results, leading to serious implications for both patients and the clinicians caring for them.
HbA1c: hemoglobin variables
Hemoglobinopathies are genetic variants that affect the structure of a patient’s hemoglobin, which, in turn, can impact an HbA1c test. There are hundreds of types and subtypes of hemoglobinopathies; most of them do not seem to have any physiological consequences nor an effect on HbA1c testing. Others are clinically significant. These include HbS (sickle cell), HbC, HbD, HbE and HbF (elevated fetal hemoglobin).
Because HbA1c reference intervals and result interpretation are predicated on the assumption of a 90-day RBC average lifespan, any conditions that shorten (such as anemia) or lengthen the red cells’ average lifespans affect the concentration of HbA1c. Assays will accurately measure the concentration of HbA1c, but they cannot compensate for unknown changes to RBC lifespan. Laboratory personnel should work with physicians to understand patients’ underlying conditions and inform them that results must be interpreted with these factors in mind. Advances in laboratory testing capabilities have led many physicians to rely more heavily on the assistance of laboratory professionals in the clinical interpretation of test results. Offering a report that includes a statement that warns that anemia and thalassemia may affect interpretation, for example, may assist busy physicians in identifying patients who need more careful consideration.
Hemoglobin variants can cause some HbA1c tests to give false high or low results, leading to treatment that is inadequate or too aggressive. The National Glycohemoglobin Standardization Program (NGSP) offers a listing of tests from various manufacturers and their interactions with the most common hemoglobinopathies. Additionally, lab personnel should be familiar with the patient populations served by their laboratory and the potential genetic variants that may be prevalent in those populations.
HbA1C: analytical variants
Analytical variables relate to factors that interfere with the testing process itself. A test is only as accurate as the sample at the time it was assayed. Some errors are introduced during the handling of the sample, so it is vital for personnel to ensure samples are managed in a way that yields accurate results. An area of particular consideration is sample pre-treatment. Manual and automated sample pre-treatment options both offer benefits; however, each also presents conditions that must be taken into consideration.
While manual pre-treatment of samples often increases testing time, labor and cost, it enables personnel to maintain tighter control of the sample. At the same time, because it is a manual process, there is greater opportunity for human error during the pre-treatment step.
Automated sample pre-treatment streamlines the pre-treatment process, reducing time, labor and costs; however, a sample can only stand upright for so long before a separation begins to occur, as the heavier red blood cells settle to the bottom of the tube. HbA1c test systems need to accommodate this behavior.
Testing frequency
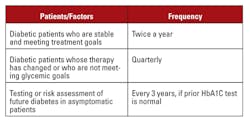
The American Diabetes Association (ADA), the Endocrine Society, and the World Health Organization (WHO) have all endorsed the use of HbA1c for diabetes screening, diagnosis, and management.10 Recommendations for testing frequency are dependent upon a patient’s condition, compliance level, and risk factors (Table 5).
The future of diabetes testing
Diabetes and its complications have become a growing concern for patients, physicians, laboratory personnel, and society as a whole. Present and future testing methods offer information that covers the spectrum of care. Laboratory professionals are often called upon to take a more active role in helping clinicians understand tests and interpret results; therefore, proper understanding of the strengths and weaknesses of today’s testing methods is imperative for proper disease diagnosis, monitoring and management. As future advancements in testing fill the gaps left by today’s technology, clinicians will continue to gain a better view of a patient’s condition, leading to more effective treatment and improved health outcomes.
REFERENCES
- Statistics about diabetes: overall numbers, diabetes and prediabetes. American Diabetes Association. http://www.diabetes.org/diabetes-basics/statistics/.
- National Diabetes Statistics Report, 2014. Centers for Disease Control. https://www.cdc.gov/diabetes/pubs/statsreport14/national-diabetes-report-web.pdf.
- Diabetes: facts and figures. International Diabetes Federation. http://www.idf.org/about-diabetes/facts-figures.
- Infographic: a snapshot of diabetes in America. American Diabetes Association. http://www.diabetes.org/diabetes-basics/statistics/cdc-infographic.html.
- History of diabetes. American Diabetes Association. http://www.diabetes.org/research-and-practice/student-resources/history-of-diabetes.html.
- Cost of diabetes. American Diabetes Association. http://www.diabetes.org/advocacy/news-events/cost-of-diabetes.html.
- Diagnosis and classification of diabetes mellitus. Diabetes Care. 2013;36 Supplement 1, S67-S74; doi:10.2337/dc13-S067.
- Sacks, David B. A1C versus glucose testing: a comparison. Diabetes Care 2011;34(2): 518-523.
- Executive summary: standards of medical care in diabetes—2012. Diabetes Care. 102012; 35(Supplement 1): S4-S10.
- Standards of medical care in diabetes. Diabetes Care.2013;36 Supplement 1, S11-S66.
Jack Zakowski, PhD, FACB, serves as Director of Scientific Affairs and Professional Relations for Beckman Coulter Diagnostics.
About the Author

Jack Zakowski, PhD, FAACC
is Principal of IVD Consulting, LLC and chaired the development of CLSI C56A, Hemolysis, Icterus, and Lipemia/Turbidity Indices as Indicators of Interference in Clinical Laboratory Analysis.He has served in governance positions with AACC, is Past President of CLSI, and is currently Chair of ISO TC212 Clinical Laboratory Testing and in vitro diagnostic Test Systems.