Evidence-based Quality Control
This article will discuss a new approach for automated hematology analyzers’ daily control limits. The discussion will cover some common issues around control of analyzers, suggest a new evidence-based approach to daily control limits, and conclude with a discussion of the benefits of this approach in the laboratory.
Some QC contexts
Too many false control rejections are the laboratory equivalent of crying wolf. Accustomed to false control rejections and not believing the problem is the analyzer, laboratorians often presume that the problem is the control and just repeat the control again. This practice often leads to multiple repetitions. It is frustrating, and difficult for operators to know when there actually is an analyzer issue.
The 1994 CAP Q-Probe study,1 completed to assess QC (Quality Control) practices and their impact on hospital laboratories, showed that 95 percent of labs repeated the same vial of control when a control run failed. In the overwhelming majority of cases, this was due to the belief that random error had occurred. (In control rules, the 13SD [Standard Deviation] means one control failure if one parameter falls outside of +/-3SD limits.) The study also found there was no benefit in using complex multi-rules or control processes for modern automated analyzers, due to the difficulty in understanding and following these complex processes. The recommendation from the study was to simplify control processes. Twenty-three years later, we have the same control issues.
When a control run fails, the first tendency is to repeat the same vial of QC. Is the analyzer truly out of range, or is it just random error? With the increased precision and accuracy of modern analyzers and the advancement in QC products, the random error issues are no longer relevant. Is the problem random error, or are QC limits rejecting good data?
It is common to build QC rules with only one parameter in mind. When using a 12SD limit for one parameter and one level of control, only 95 percent of the normal recovery is captured. Everything outside the 2SD range is rejected. This rejects five percent of good results, and if a second level of that control is run, the rejection level increases to nine percent. These valid results are falling outside that 12SD limit.
Hematology controls are multiplex controls: each control level is testing multiple parameters at the same time. Therefore, since one level has 35 parameters, the probability of one parameter exceeding the 12SD limit is up to 80 percent. How, then, is that QC run handled? Typically, the entire run is deleted, and normal data from the other parameters is rejected as well.
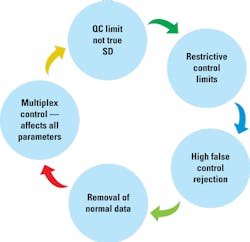
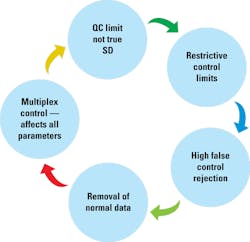
This can cause a vicious cycle of restrictive control limits (Figure 1). By creating restrictive control limits, we get a high rate of control runs out of range. Out-of-range data are removed along with normal recovery for the other parameters, and this causes SD values to decrease. The QC limits based off those SD values end up not being a true representation of the analyzer’s performance, and the cycle continues. Control limits decrease, out-of-range results increase, and more normal data is removed, causing laboratorians to believe there is a true analyzer issue and to re-run the QC vial.
Hematology controls are biological materials, and each batch of cells is from a different donor. The donor cells are processed and stabilized to increase the shelf life of the control material. This is better for control and monitoring of the analyzer’s performance. If the cells in the hematology control material are not changing similarly to whole blood, the entire analytical system may not be tested to judge the accuracy and precision of analyzers.
Comparing two analyzers
Here are two (actual) analyzer hemoglobin controls files. Both are using a common +/-3SD control limit. Both have the same target and appear to be similar in performance, with runs being above and below the target. Since they are both using a +/-3SD control limit with like dispersion around the mean, one would presume they have the same quality. The only way to know for sure is to look deeper into the data (Figure 2).
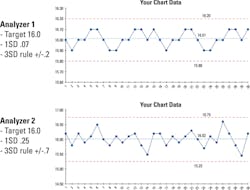
Closer examination of the details reveals that Analyzer 2 has three times the variability as Analyzer 1. This can be very common in labs that only look at multiples of standard deviation and not the details around what an SD value truly means. A deeper look makes it clear that the two analyzers do not have the same quality. Analyzer 1 has an SD of 0.07 and a total control range of 0.4 g/dL, while Analyzer 2 has an SD of 0.25 and a total control range of 1.5 g/dL. This illustrates how too wide a control limit can hide a systematic error. Too narrow a control limit can give the appearance of a systematic error.
Laboratories like to release stable, accurate results. Some even strive for a zero bias. Here is an example of RBC parameters recovering +1 SDI to its peer group. The lab observed this +1 SDI bias and requested analyzer calibration to remove that bias.
The analyzer was checked to ensure correct performance of the unit. The analyzer was calibrated to remove the bias. After the calibration, the RBC was now trending -1 SDI to the peer group, so the lab requested to repeat the calibration. Performance was verified again, and no issue was found. Again, the analyzer was calibrated to remove the bias. After the second calibration, the RBC again showed a positive bias. Why?
The details show each SDI is only 0.6 percent. Considering the analyzer precision and calibrator variability, it is easy to over-adjust by a quarter to a half of a percent. As seen in this example, just recalibrating can increase the variability in patient results. Monitored patients can have two or even three times the variability added to their results when chasing a zero bias. For hematologic testing, consider that if there are no analyzer issues or repairs and calibration is consistently being adjusted, patient result variability will increase. In this situation, maintaining a small, consistent bias is better than chasing perfection.
An evidence-based approach
We have examined several issues affecting daily control of hematology analyzers. To address these issues, we found a new approach to develop daily control limits—an evidence-based approach that retains complete error detection abilities while significantly decreasing the false control rejections that desensitize the lab to control failures. Daily control error limits provide appropriate error detection while maintaining low false control rejections. They are not assay sheet limits that provide only one large range within all analyzers recover or a stand-alone lab quality assurance manual. Evidence-based limits are daily control limits to monitor changes or issues affecting analyzers.
Unlike older processes that only use a multiple of standard deviation to build limits, this new approach uses a performance goal, allowable bias, and precision of the test method to build daily error detection limits with minimal false rejections. The limits are specific to each analyzer model, level, and parameter. Using this method, simple percent limits can be provided that capture true analyzer performance. This allows detection of analyzers that are not recovering as expected to start the corrective action process.
Once a performance goal is determined, the quality of a product can be compared to the performance goal to measure parameter quality and ongoing monitoring for control of the processes. Once the true performance of controlling a test method is identified, a total allowable percent limit for daily control activities can be built. Using the same performance goal, or total allowable error control limits for each analyzer, allows identification of analyzers with issues that could have been hidden when using only a multiple-of-standard-deviation approach.
To improve daily control processes, analyzer manufacturers can do some of the work. They can gather data, build the error detection limits, and develop a simple approach for implementation in the lab. Limits should not be restrictive, which produces false control rejections even in the normal control variability, but rather involve a balanced approach to error detection while reducing false control rejections.
One common way to set limits is based on Six Sigma processes that are specific to each model, parameter, and level. The true control model performance can be put on a Sigma scale to determine the right balance of error detection. Outcomes will differ depending on what Sigma levels are set.
- If the control limit is set at Six Sigma levels, there would be no false control rejections, but poor error detections since the normal control bias or precision could have a significant change before falling outside of the performance goals.
- If the control limit is set at Two Sigma, there would be a high rate of false control rejections since the performance goals would be in the normal control recovery.
- If the control limit is set at Four Sigma quality, there is an optimal balance between error detection and low false control rejections. Since the control limits are set at the limits of normal recovery, any changes to the analytical system will increase the control rejections. When the analytical system is stable, there are almost no false control rejections.
Benefits to the lab
The evidence-based approach to QC limits addresses many of the issues that have plagued labs for the last 20 years by addressing high false rejections while maintaining 100 percent possible error detection. In most labs, running QC is a cumbersome process involving:
- The potential of outliers that need to be dealt with
- The hassle of investigating and documenting
- The fact that if the cause of the outlier is not found, labs frequently suspect that limits are the issue rather than that the analyzer has a problem.
- The fact that, if the issue is limits, labs often consider increasing them to get the QC within range. (Widening the limits may make life easier, but changing the limits can be an arbitrary process that does not address the root cause of the QC failure.)
With evidence-based QC limits, there is no longer a need to fight to get the QC in range. These limits take the hassle out of running QC as they address the cause of many of the QC outliers. They also help more easily identify when there has been a change in the analyzer’s performance. With these limits, the amount of QC material used is reduced because frequent rerunning no longer is necessary, and turnaround times are decreased because there is no longer a wait for the QC to pass. This increases productivity and provides greater confidence in the patient results obtained.
Quality is important to everyone in the laboratory. Narrowing QC limits will not improve the quality of results. Narrow limits do not result in better quality. They only increase the instances of false rejections with the result that lab leaders may become desensitized to true analyzer issues.
QC limits help identify whether there has been a clinical change in the test system. Labs must use appropriate limits to detect any change yet not have limits so restrictive that they falsely indicate an analyzer issue. Evidence-based QC limits strike the balance between error detection and false rejections.
REFERENCE
- Steindel SJ, Tetrault G, Quality Control practices for calcium, cholesterol, digoxin, and hemoglobin: a College of American Pathologists Q-Probe study in 505 hospital laboratories. Arch Pathol Lab Med. 1998;122(5):401-408.
Scott Lesher is an alumnus of the U.S. Army Medical Academy graduate program for biomedical equipment technicians. He has twenty-two years’ experience as a biomedical technician, of which eighteen years were specialized in support of automated hematology analyzers and quality control processes. He joined Sysmex in 2007 to manage the assay lab and subsequently moved into his current role as the Director of Quality Assurance.