Automatic reading and segregation of cultures
The value proposition for full laboratory automation and improved time to results has arrived.
Full laboratory automation in Microbiology is high on the wish list of many laboratories in the United States. In fact, in an article published in the Journal of Clinical Microbiology (JCM), Bourbeau and Ledeboer assert that “the changes associated with selection and implementation of microbiology automation solutions will place significant management and financial challenges upon laboratory leadership,”1 and that the world of clinical microbiology is “on the cusp of a dramatic change that will sweep a wave of automation into clinical microbiology laboratories.” But, as Greub and Prod’hom have expressed, “the challenge for clinical bacteriologists is to determine…the ideal automated system for their own laboratory.”2
One important recent change that is hastening the adoption of full laboratory automation is the change in sample collection devices. In an important guideline prepared for the Infectious Diseases Society of America and the American Society for Microbiology, Baron et al highlight the importance of proper collection and transport of samples. They point out that “unlike other areas of the diagnostic laboratory, clinical microbiology is a science of interpretive judgment that is becoming more complex, not less. Even with the advent of laboratory automation and the integration of genomics and proteomics in microbiology, interpretation of results still depends on the quality of the specimens received for analysis.”3 Advances in collection devices, paired with liquid-based microbiology (LBM), developed in recent years, have improved sample quality and have opened the door to automate front-end specimen processing, one of the most manual areas of the laboratory. In fact, Bourbeau and Ledeboer add that “the adoption of liquid microbiology specimen transport has allowed microbiology laboratories to simplify collection and identification systems, creating a work flow that can be optimized with automation.”1
Different pressures, such as increasing sample volume, aging workforce, and decreasing reimbursement, are making the concept of automation a pressing need for the laboratory. “Advances in automation have reduced the time for specimen processing by using robotic systems to inoculate, label, track, and incubate plates for culture. However, culture analysis is still a time-intensive and costly procedure for the laboratory as technologists have to interpret colony counts to differentiate pathogens from normal flora for several hundred plates a day,”4 stated Faron et al in a scientific poster presented at the annual meeting of the European Congress of Clinical Microbiology and Infectious Diseases this year. Software that can automatically segregate patients’ sample cultures based on colony counts and/or recognition of the specific morphology or appearance of the colonies will completely revolutionize the Microbiology laboratory by saving time to results and improving the speed of diagnosis of infectious disease. Image analysis capabilities and the strength of the algorithms for automatic reading and segregation of cultures, regardless of the manufacturer of plated media, will separate the mechanization of manual processes from true game-changing innovation in image analysis in the field of full laboratory automation for Microbiology, and will constitute the most important factor when choosing a system.
Automated segregation of growth and no growth
The image analysis software is the most powerful component of full laboratory automation, and it is at the heart of digital microbiology. Without strong algorithms, the return on investment and the value of full laboratory automation are limited because a lot of the tasks still have to be done manually. It is important that the algorithms use an open approach to different media manufacturers and different types of media, and that they can be applied to both whole and bi-plates. Many laboratories in North America use bi-plates for urine investigations. So, availability of reading algorithms for bi-plates is an important feature to consider when picking a full laboratory automation system.
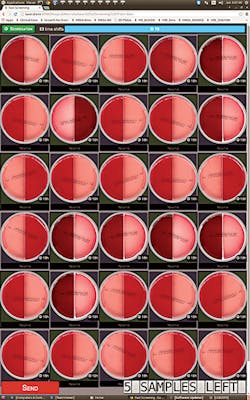
It is well-known that, in the U.S., “urinary tract infections account for seven million visits to physicians’ offices and over one million hospital admissions per year.”5 So, naturally, urines are one of the highest sample volumes received in the Microbiology laboratory. In fact, “urinalysis is the third major diagnostic screening test in the clinical laboratory, only preceded by serum/plasma chemistry profiles and complete blood count analysis.”6 In the U.S., urines are tested on blood and MacConkey whole plates or bi-plates or blood and chromogenic bi-plates. The Clinical Microbiology Procedures Handbook, in the Protocol for workup of urine culture, calls for a 1µl loop for quantitative purposes.5 The urine reading algorithm must be able to use the correct sample volume to get accurate colonial separation for an accurate account. It must also work on blood/MacConkey or blood/chromogenic medium, in addition to being able to recognize the orientation of the plates no matter which side of the plate is blood and which is the other medium (Figure 1). The bi-plate urine segregation algorithm applies the appropriate rules based on a customizable expert system of rules for growth interpretation. So, two automatic results can be received instantaneously from one culture plate. For example, by applying “if and then” rules, the system could flag if the patient is a pregnant woman or is of child-bearing age, then look for small numbers of white Group B Strep colonies on the chromogenic plates or look for small numbers of hemolytic colonies on blood plates.
A recent study has been published on software that can “read digital images and provide quantitation of Colony Forming Units from blood agar plates.”4 The software counts Colony Forming Units (CFUs) on blood plates, and segregates no-growth cultures and can categorize growth—for example 0-10 CFUs, 10-100 CFUs, and >100 CFUs—which helps overall “to reduce the cost of urine cultures by sorting plates based on colony growth.”4 The study concluded that the quantitative software was accurate at discerning no-growth without any false results. It is important to mention that laboratorians are still required to validate the algorithms decision before the culture result is finalized in the patient record. However, the segregation helps improve efficiencies and reduce turnaround time by grouping and pre-sorting the negatives and the positives so that the staff can screen and result faster.
Analysis of different chromogenic media
According to Faron et al, “chromogenic detection module (CDM) is software that analyzes digital images for a customizable target color by converting red-green-blue (RGB) images into a 3-dimensional space composed of hue, saturation, and value (HSV), creating a ‘bubble-shaped’ tolerance level for defining ‘nonnegative’ media plates.”7 Another example of the value that digital microbiology and image analysis brings to the healthcare system is the application of the software to detect and differentiate methicillin-resistant Staphylococcus aureus (MRSA) on different types of chromogenic media. A recent multi-center, unprecedented study published by the JCM compared a “software that discriminates and segregates positive and negative chromogenic methicillin-resistant Staphylococcus aureus (MRSA) plates by recognition of pigmented colonies”7 to manual reading done by a laboratorian. The sample size was almost 60,000 specimens, and the chromogenic media used for the study was manufactured by three different companies (so the software for color recognition was not tied to a specific manufacturer’s plated media). The study concluded that “the digital software had a sensitivity of 100 percent and a specificity of 90.7 percent with the specificity ranging between 90.0 and 96.0 across all sites. The results were similar using the three different agars with a sensitivity of 100 percent and specificity ranging between 90.7 percent and 92.4 percent. These data demonstrate that automated digital analysis can be used to accurately sort positive from negative chromogenic agar cultures regardless of the pigmentation produced.”7 Perhaps even more impressive, the software was capable of detecting an additional 153 cases where “small colonies were not visually detected by the initial manual examination but upon review should have been called positive by the laboratory.”
An even bigger study, also published by the JCM, compared a Chromogenic Detection Module to manual reading to screen for vancomycin-resistant enterococci (VRE). This study included 104,730 specimens processed by three different laboratories in Canada, the Netherlands, and the U.S. “Automation agreed with manual analysis in 90.1 percent of all specimens tested with a sensitivity and specificity of 100 percent and 89.5 percent, respectively.8 No false negatives were reported by the software, and in fact, 498 specimens were marked positive by the Chromogenic Detection Module software and were missed by the laboratorian. In the study, 84 percent of all samples were negative by both systems. Currently, the laboratorian still has to confirm the negatives, but this can be batched in groups of 30 plates per screen for rapid review and reporting. The study concludes that “automatic reporting of negative plates would have several benefits such as decreasing turnaround time, especially in laboratories that are not open 24/7, support antimicrobial stewardship by allowing pharmacists and physicians to guide practices based on both patient health and laboratory results, and reduce laboratory labor costs as technologists would not have to view any negative plates, which in this study was the vast majority of specimens tested.”8
What’s next for clinical microbiology?
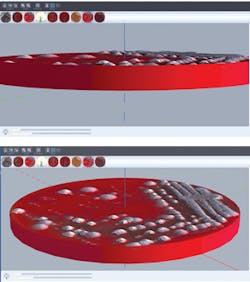
With the level of sophistication that lies behind current image analysis software, the next frontier for clinical microbiology is automated colony picking. The module for automated colony picking works using 3D digital coordinates previously specified by the laboratory staff to process further workup and investigations (Figure 2). The workups include McFarland suspensions for antibiotic susceptibility testing (AST) and traditional organism identification by biochemistry and purity plates, seeding MALDI-TOF target plates and applying the matrix, among others.
As microbiology laboratories around the U.S. brace for this exciting new wave of automation, it is important for lab leaders to select a system that has the software capabilities necessary to automate internal processes and the power to considerably reduce turnaround times by pre-sorting samples to facilitate a lean workflow. It is an exciting time for Microbiology: We are part of one of the largest breakthroughs in technology in this generation.
REFERENCES
- Bourbeau, PP, Ledeboer NA. Automation in clinical microbiology. J Clin Microbiol. 2013 51(6):1658-1666.
- Greub G, Prod’hom, G. Automation in clinical bacteriology: what system to choose? Clin Microbiol and Infect. 17(5): 655–660.
- Baron EJ, Miller M, Weinstein MP, et al. A Guide to Utilization of the Microbiology Laboratory for Diagnosis of Infectious Diseases: 2013 Recommendations by the Infectious Diseases Society of America (IDSA) and the American Society for Microbiology (ASM). Clin Infect Dis. 2013;57(4).
- Faron ML, Blake W. Buchan T, et al. (2016). Automated digital quantitation of urine cultures using the WASPLab. 26th European Congress of Clinical Microbiology and Infectious Diseases (ECCMID). Amsterdam.
- Garcia L. 2010. Urine Cultures, p 410-440. In Clinical Microbiology Procedures Handbook, 3rd Edition. ASM Press, Washington, DC. doi: 10.1128/9781555817435.ch3.12.
Delanghe J, Speeckaert M. Preanalytical requirements of urinalysis. Biochem Med. 2014; 24(1):89–104. - Faron ML Buchan BW, Vismara, C, et al. Automated scoring of chromogenic media for detection of methicillin-resistant Staphylococcus aureus by use of WASPLab image analysis software. J Clin Microbiol. 2016;54(3)620-624.
- Faron ML, Buchan T, Coon C, et al. Automatic digital analysis of chromogenic media for vancomycin resistant enterococci screens using the Copan WASPLab. J Clin Microbiol. Accepted Manuscript Posted Online July 13, 2016.
Gabriela Franco serves as Director of Marketing for COPAN Diagnostics. Gabriela has more than 14 years of experience in marketing and product management. She holds a BS in Business Administration and Marketing, and a Master of International Management degree.


