Bringing on the next wave of spatially resolved transcriptomics
Diseases often originate in highly specific regions or cell types within the body. Why? Because healthy cells are not uniform: there are hundreds of different cell types that display different characteristics, perform different roles, and malfunction in equally diverse ways. But those errors don’t occur in a vacuum — all cells are influenced by their location within a tissue.
As scientists seek to understand the origins of human disease, there is a growing movement to catalog all the cells in the human body while preserving spatial context — a field of study called spatial biology or spatial genomics. In spatial biology, scientists use a combination of molecular profiling and imaging techniques to produce an atlas of the cells and cell types in a tissue. Cells may be cataloged based on their transcriptome, proteome, metabolome, and their metabolic flux within intact tissue samples to preserve the spatial context of the information. Getting the full picture requires a large quantity of high-quality data that has, until recently, been slow to acquire. But now, spatial biology is experiencing a step change, thanks to a new generation of advanced spatial genomics technologies that expand the quantity and quality of information that can be gained from a single experiment.
While spatial genomics tools are not yet common in clinical labs, they likely will be soon. The depth and detail of data that spatial genomics tools can efficiently capture offer countless opportunities for establishing new biomarkers for diagnostic testing. Furthermore, spatial genomics instruments generate nuanced, high-volume results that could expand what is possible through precision medicine. Here, we’ll discuss the science behind an emerging spatial genomics technology, massively multiplexed single-molecule imaging technology, followed by some of its potential clinical applications.
Setting a higher standard for data collection
Resolution matters. Scientists need spatial techniques that are capable of distinguishing individual cells to identify which cell types are altered in a diseased state. Techniques with single-cell resolution can help characterize underlying molecular changes, visualize morphology and behavioral changes, and identify relationships with neighboring cells. Together, these valuable data points are essential to improving our understanding of biological systems and using that to advance human health.
Time is of the essence. To capture spatial genomic data, scientists need tools that can capture high-resolution cellular and molecular information while preserving spatial context. But to capture this data at a scale on par with the vast number of cells in the human body, high-throughput strategies are critical. So far, conventional imaging-based methods, such as RNA FISH, that preserve spatial context have not been high throughput enough to make cell atlasing commonplace. On the other hand, sequencing-based spatial genomics technologies on the market don’t offer true single cell resolution and often suffer from poor sensitivity. However, a new class of imaging-based spatial genomics methods that map cells based on their gene expression — i.e., their transcriptomes — show great promise.
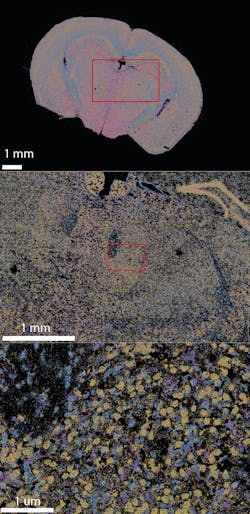
Here we will discuss one such emerging spatial genomics technology. Massively multiplexed single-molecule imaging technology enables researchers to accelerate the cell atlasing process by mapping whole tissues at single-cell resolution on an unprecedented scale and massively multiplexed level (Figure 1).1 A growing number of groups across the United States are using this technology to produce cell atlases relevant to their physiological area of interest, with more on the way.2-5 Based on their achievements, it is possible to imagine a day when it will be routine to generate reference maps that unlock the cellular and molecular mechanisms underlying any disease.
Visualizing gene expression
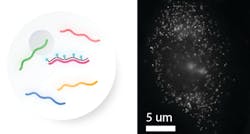
Massively multiplexed single-molecule imaging technology is based on FISH (Fluorescence In Situ Hybridization), a highly sensitive and quantitative way to measure gene expression.6 In FISH assays, RNA probes hybridize to gene transcripts within the cells of a tissue. These tagged transcripts are then imaged to visualize their location. While powerful in specific settings, these methods face a major technological challenge: it is difficult to visualize more than four gene species simultaneously, as the multiplexing power is dependent on how many spectrally distinct fluorophores can be used in a single experiment.
In contrast, massively multiplexed single-molecule imaging technology has not only overcome these challenges but has also pushed the limits of the volume and quality of available data. It employs strategies from a highly sensitive, single-molecule variation of FISH (Figure 2) 7capable of visualizing individual transcripts. By combining smFISH with combinatorial labeling, sequential imaging, and error-robust barcoding strategies, massively multiplexed single-molecule imaging technology can massively multiplex the number of genes that can be imaged per experiment. Together, the stepwise approach to massively multiplexed single-molecule imaging technology experiments (outlined below) enables scientists to spatially profile the expression of hundreds to thousands of genes across whole tissues. It identifies individual transcripts at the highest detection efficiency available and resolves their location at subcellular, nanometer-scale resolution. With the location and quantity of gene transcripts recorded, this spatially resolved RNA-profiling data gives a physical picture of the cell or tissue of interest.
The science behind massively multiplexed single-molecule imaging technology
Design: To set up a massively multiplexed single-molecule imaging technology experiment, researchers must first select a gene panel of hundreds to thousands of genes of interest. An error-robust binary barcode, a series of “0” and “1,” is assigned to each gene of interest. Then, encoding probes, which effectively imprint the desired barcode onto each RNA species, are generated to hybridize to each gene species in the panel, and at least 20 different encoding probes are used for each gene. This multi-probe strategy produces an exceptionally high detection efficiency that is an order of magnitude higher than other spatial technologies; it faithfully identifies target RNA molecules, even those transcribed at very low frequencies. The probes are also designed so that fluorescent labels can hybridize in a combinatorial fashion, allowing for a massively multiplexed experiment.
Capture: To run a massively multiplexed single-molecule imaging technology experiment, scientists must prepare a tissue slice or cell culture sample and stain it with the library of gene panel probes. Then, the sample must go through a series of steps where it is hybridized with a set of fluorescent readout probes, imaged, washed to remove the fluorescent signal, and then treated with another set of fluorescent readout probes. These steps are repeated until all bits in the binary barcode are imaged, and the optical barcode generated from this process will be used to resolve the quantity and location of each transcript. The amount of time that it takes to capture massively multiplexed single-molecule imaging technology measurements varies depending on the size of the gene panel being probed and the area size of tissue slices being imaged in the sample, but in general, each slice of a sample will take a day to complete.
Analysis and visualization: A single massively multiplexed single-molecule imaging technology experiment produces numeric data and images that are largely analyzed using computational methods. Software must be used to compile the different rounds of imaging data to decode the fluorescent signal, determine the barcode, and match it with the preassigned binary barcode of every individual RNA molecule in the sample. This process produces a massive body of data about the location and identity of hundreds of millions of RNA species distributed throughout hundreds of thousands of cells. Furthermore, massively multiplexed single-molecule imaging technology images provide information about cell shape, cell size, and cells’ interactions with their neighbors.
Massively multiplexed single molecular imaging technology in action
The technology was recently used to generate a receptor map of the mouse brain.8 The dataset revealed new information about the expression of over four hundred GPCRs — a vast class of transmembrane signaling proteins, many of which have been implicated in various neurodegenerative disorders. Although GPCRs come in an incredibly diverse array of “flavors,” they are expressed at such low levels that their function was only partially understood. It was largely unclear which cell types express these proteins, information which would provide vital clues as to their roles in the brain. Now, however, the massively multiplexed single-molecule imaging technology-generated cell atlas has revealed where GPCRs are expressed. Armed with this information, researchers can begin unraveling these genes’ role and examine how their expression changes in disease-associated cell types. Down the line, this data may serve as a springboard to guide the clinical development of new diagnostics for neurological disease.
But the brain is just the beginning. As more labs use massively multiplexed single-molecule imaging technology to map both healthy tissue and tissue representing a variety of disease states, these will serve as reference maps for the field. Together, these maps will provide an unprecedented view into the cell and molecular changes that occur as a result of disease that may soon aid in a new generation of clinical diagnostics.
Clinical applications on the horizon
Massively multiplexed single-molecule imaging technology stands to make a dramatic impact in the clinic thanks to its massively multiplexing capabilities and the high-volume information it produces. It can readily profile hundreds to thousands of biomarkers at the same time, which could facilitate the biomarker discovery process for developing new diagnostic tests. Specifically, by profiling groups of biomarkers simultaneously, clinical labs could potentially use the data it captures to stratify patients for therapeutic intervention. With test results offering a more fine-tuned evaluation of a patient’s disease, clinicians may be better able to optimize treatment, determine prognosis, and predict and monitor treatment response. Furthermore, massively multiplexed single-molecule imaging technology-generated cell atlases can also map and catalog different cell types and characterize cell state and function in complex tissue. This information can provide an additional level of insight into how genes function and how different cell types work together in healthy versus diseased tissue, illuminating new physiological hallmarks that that can be used in tissue pathology. Overall, massively multiplexed single-molecule imaging technology evaluation may represent a new generation of clinical testing that empowers labs to deliver more personalized, detailed diagnoses, with the potential to elevate medical care and enable new generation of precision medicine that will advance human health.
Jiang He, PhD, is Co-Founder and Director of Scientific Affairs at Vizgen, a Cambridge, MA-based company, which holds the patents for MERFISH and has commercialized the MERSCOPE Platform
References:
- Chen KH, Boettiger AN, Moffitt JR, et al. RNA imaging. Spatially resolved, highly multiplexed RNA profiling in single cells. Science. 2015;348(6233):aaa6090. doi:10.1126/science.aaa6090.
- Zhang M, Eichhorn SW, Zingg B, et al. Spatially resolved cell atlas of the mouse primary motor cortex by MERFISH. Nature. 2021;598(7879):137-143. doi:10.1038/s41586-021-03705-x.
- Favuzzi E, Huang S, Saldi GA, et al. GABA-receptive microglia selectively sculpt developing inhibitory circuits [published correction appears in Cell. 2021 Oct 28;184(22):5686]. Cell. 2021;184(15):4048-4063.e32. doi:10.1016/j.cell.2021.06.018.
- Xia C, Fan J, Emanuel G, et al. Spatial transcriptome profiling by MERFISH reveals subcellular RNA compartmentalization and cell cycle-dependent gene expression. Proc Natl Acad Sci U S A. 2019;116(39):19490-19499. doi:10.1073/pnas.1912459116.
- Su JH, Zheng P, Kinrot SS, et al. Genome-Scale Imaging of the 3D Organization and Transcriptional Activity of Chromatin. Cell. 2020;182(6):1641-1659.e26. doi:10.1016/j.cell.2020.07.032.
- Huber D, Voith von Voithenberg L, Kaigala GV. Fluorescence in situ hybridization (FISH): History, limitations and what to expect from micro-scale FISH?. Micro and Nano Engineering. 2018;(1):15-24. doi:10.1016/j.mne.2018.10.006.
- Femino AM, Fay FS, Fogarty K, et al. Visualization of single RNA transcripts in situ. Science. 1998;280(5363):585-590. doi:10.1126/science.280.5363.585.
- Rees V. Spatial genomic and transcriptomic imaging in drug discovery. Drug Target Review. https://www.drugtargetreview.com/article/95611/spatial-genomic-and-transcriptomic-imaging-in-drug-discovery/. Published August 2021. Accessed November 2021.
Jiang He, PhD, Co-Founder and Director of Scientific Affairs atVizgen, a Cambridge, MA-based company, which holds the patents for MERFISH and has commercialized the MERSCOPE Platform.
About the Author

Jiang He, PhD
is Co-Founder and Director of Scientific Affairs at Vizgen, a Cambridge, MA-based company, which holds the patents for MERFISH and has commercialized the MERSCOPE Platform.