PCR: a versatile tool—from detecting genetic diseases and cancers to monitoring stability after bone marrow transplants
Polymerase chain reaction (PCR) is the foundation for hundreds of molecular DNA tests for the detection and monitoring of a wide range of genetic diseases.
Molecular testing methods and examples of the diseases detected include:1-12
- Qualitative fluorescence PCR (QF-PCR): Detection of aneuploidy (such as Down syndrome) and repeat expansion diseases (such as Fragile X and Huntington’s disease).
- Multiplex Ligation-dependent Probe Amplification MLPA® and Methylation Specific (MS-MLPA®) (MRC-Holland reference): Detection of diseases from insertions/deletions/point mutations; including predisposition to cancer (BRCA 1), neuromuscular disorders (Duchenne muscular dystrophy), and aneuploidy.
- Microsatellite instability: Detecting cells deficient in DNA repair capabilities, microsatellite instability-high (MSI-H), or mismatch repair deficient (dMMR) in solid tumors.
- QF-PCR using human identity chemistries is also an essential tool in monitoring engraftment post-transplant.
QF-PCR - aneuploidy
Aneuploidy (an abnormal number of chromosomes) is the most frequent genetic disorder observed in live births and miscarriages, with trisomies being the most prevalent, accounting for approximately 53 percent of all chromosome abnormalities. QF-PCR is quantitative, and the laboratory and data analysis steps can be partially automated for accurate results of more samples in less time than the traditional karyotype method. QF-PCR uses chromosome-specific primers to amplify DNA fragments for each of the chromosomes of interest. DNA fragments are separated with capillary electrophoresis and analyzed by fragment size and number of fragments. The peak height or area, is used to quantify the amount of DNA amplified, determining if the expected pair of each chromosome or aneuploidy is present.
Three DNA fragments—visualized as peaks of approximately the same height in an electropherogram, or peak ratios of 2:1 and 1:2—are indications that the sample is in the trisomic range. Custom chemistries or commercial PCR kits provide primer sets that will detect chromosomes 13, 18, 21, X, and Y. In many cases these multiplexes are sufficient for conclusively detecting and quantifying aneuploidy.
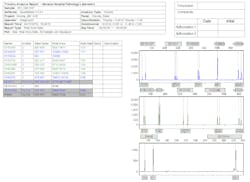
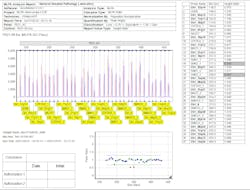
The peak pattern shown in Figure 1 is an example of a sample that is in the trisomic range for Down syndrome. Peak ratios at loci D21S11 (1:1:1), D21S1437, and IFNAR (1:2) are typical indicators of trisomy 21. Loci D13S634 and D21S1311 contain only single peaks (non-informative). The remaining loci have high heterozygous balance, which is typical of two copies of the homologous chromosomes.
Repeat expansion diseases
Expansions of simple sequence repeats, mainly but not limited to tri-nucleotide repeats, are responsible for over 40 human diseases. In general, an increasing number of repeats results in more severe phenotypes and the number of repeats increase (expand) as the disease gene is inherited. PCR primers are used to amplify the triplet or hexanucleotide repeats. These fragments are separated by capillary electrophoresis. Large repeats are in the high molecular weight range. Molecular weight and number of repeats do not have a strictly linear relationship for larger fragments. Reporting requires a correction for the non-linear relationship. DNA control(s) with fragments of a known number of repeats are included in the PCR and capillary electrophoresis. The size and known number of repeats of the control DNA are used to calculate correction and mobility factors for converting the sample peak size (molecular weight) into a number of repeats.
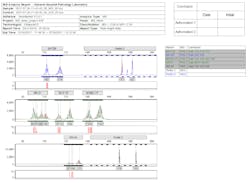
Figure 2 is a report containing the electropherogram of a Huntington’s control sample used to calculate the correction and mobility factors.
Figure 3 is a report of a sample with a single fragment in the normal range and detection of a full expansion of 176 CAG repeats.
MLPA®
Multiplex ligation-dependent probe amplification (MLPA®) is a PCR-based technique developed by MRC-Holland. Since its introduction in 2002, it has become a widely-used and effective technique for detecting copy number variations associated with many common diseases and cancers. MLPA is simpler, more sensitive, and less time intensive when compared to other traditional techniques for detecting copy number variations, including FISH, and Southern blotting.
The MLPA reaction is composed of five steps:
- DNA denaturation;
- Hybridization of MLPA probes;
- Ligation reaction of the two probes hybridized to their target sequence;
- PCR reaction; and
- Separation of resulting DNA fragments by capillary electrophoresis. Peak height or area of test samples is compared to control samples with normal copy number for each probe.
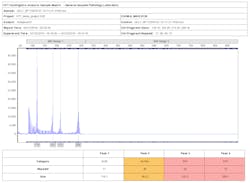
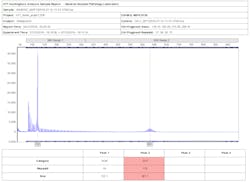
Figure 4 is an example of a sample with no duplications or deletions for a spinal muscular atrophy (SMA) test. The red trace in the electropherogram is the normal sample. The blue trace is the test sample. Figure 5 illustrates heterozygous deletions at the two SMN_2 probes, as the test sample peak heights are half the height of the normal sample.
Microsatellite instability
Microsatellites are stretches of DNA where a 1-5 base pair sequence is repeated several times. The most common microsatellite in humans is a dinucleotide repeat of CA which occurs tens of thousands of times across the genome.
Microsatellite instability (MSI) is a key factor in several cancers including colorectal, endometrial, ovarian, and gastric cancers. Colorectal cancer studies have demonstrated two mechanisms for MSI occurrence. The first is in hereditary nonpolyposis colorectal cancer (HNPCC) or Lynch syndrome, where an inherited mutation in a mismatch-repair gene causes a microsatellite repeat replication error to go unfixed. The replication error results in a frameshift mutation that inactivates or alters major tumor suppressor genes. These genes are essential in the regulation of the cell cycle and, ultimately, the prevention of cancer.
The second mechanism whereby MSI causes colorectal cancer is an epigenetic change which silences an essential mismatch-repair gene. In both cases, microsatellite insertions and deletions within tumor suppressor gene coding regions result in uncontrolled cell division and tumor growth. Five markers have been recommended by the National Cancer Institute to screen for MSI in HNPCC tumors (often called Bethesda markers). Generally, MSI detection in two of the markers is considered a positive result or high probability of MSI (MSI-H).
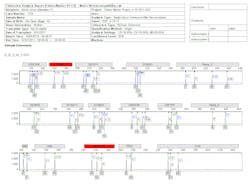
Figure 6 is an example of a sample with MSI-H. The tumor sample fragments are compared to the fragments from non-tumor tissue of the same source by overlaying the electropherograms. The normal tissue is the red trace; the other traces are the tumor sample. Each of the polymorphic loci have additional microsatellite fragments in the tumor sample. The summary table highlights any of the markers with an increase in the number of microsatellite fragments.
Monitoring chimerism
Monitoring post bone marrow transplant chimerism, the extent to which the donor cells have engrafted in the recipient, is essential to confirm stability or detect any signs of graft failure. The analysis uses the same QF-PCR human identity chemistries which amplify short tandem repeats (STRs) used for forensic human identity testing. Highly polymorphic STRs are amplified using a multiplex of STR primers and separated by capillary electrophoresis. Peak heights or areas of fragments from donor and recipient are used to calculate chimerism, the percent of the DNA from the donor.
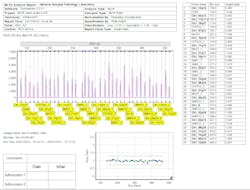
Figure 7 is an electropherogram from a control 3:1 mixture. Peaks attributed to donor, recipient, or shared are indicated by the flag labels (D, R, D/R). Figure 8 contains the corresponding result table of the percent donor at each locus, total percent donor chimerism, and quality metrics.
REFERENCES
- V Cirigliano, et al. Rapid prenatal diagnosis of common chromosome aneuploidies by QF-PCR, results of 9 years of clinical experience Prenat Diagn 2009; 29:40–49.
- Masoudzadeh and Teimourian Rapid Prenatal Diagnosis of Chromosomal Aneuploidies Using Quantitative Fluorescence Polymerase Chain Reaction (QF-PCR), J Gynecol Reprod Med, 2017; 1:1-5.
- H Paulson. Repeat expansion diseases. Handbook Clin Neurol. 2018;147:105-123.
- Budworth and McMurray. A Brief History of Triplet Repeat Diseases. Methods Mol Biol. 2013; 1010: 3–17.
- Hills, et al. MLPA for confirmation of array CGH results and determination of inheritance Molecular Cytogenetics. 2010; 3:19.
- http://www.mlpa.com/WebForms/WebFormMain.aspx?Tag=_fNPBLedDVp38p-CxU2h0mQ..
- V. Casadio, et al. DNA Methylation profiles as predictors of recurrence in non-muscle invasive bladder cancer: an MS-MLPA approach Journal of Experimental & Clinical Cancer Research. 2013; 32:94.
- Proctor, et al. Molecular Diagnosis of Prader–Willi and Angelman Syndromes by Methylation-Specific Melting Analysis and Methylation-Specific Multiplex Ligation-Dependent Probe Amplification. Clinical Chemistry (2006); 52:7 1276–1283.
- https://www.fda.gov/newsevents/newsroom/pressannouncements/ucm560167.htm
- Overman, et al. Nivolumab in patients with metastatic DNA mismatch repair deficient/microsatellite instability–high colorectal cancer (CheckMate 142): results of an open-label, multicentre, phase 2 study. Lancet Oncol. 2017 Sep; 18(9): 1182–1191.
- Clark, et al. Monitoring of chimerism following allogeneic haematopoietic stem cell transplantation (HSCT): Technical recommendations for the use of Short Tandem Repeat (STR) based techniques, on behalf of the United Kingdom National External Quality Assessment Service for Leucocyte Immunophenotyping Chimerism Working Group. British Journal of Hematology. 2015; 168, 26–37.
- D Kristt and T Klein. Reliability of quantitative chimerism results: assessment of sample performance using novel parameters Leukemia. (2006); 20, 1169–1172.
About the Author

Teresa Snyder-Leiby
PhD has served as product manager for DNA fragment analysis software at SoftGenetics for 11 years. Teresa was a biology professor at the State University of New York (SUNY New Paltz) prior to joining the support and development team at SoftGenetics.

