QC design: it’s easier than you think

Perception can be everything, and somehow it’s become a widely accepted belief: QC design is complicated. Mention statistical quality control, and many laboratorians’ hearts race and their palms get sweaty….it is difficult, they say; it requires higher math, it’s time-consuming, and it has to be perfect.
The reality is far from that. Those on the cutting edge of QC design and strategy say that appropriate QC design may vary depending upon the goals of the lab and that there often is no single right answer. And maybe that’s what makes many uncomfortable. This article reviews key concepts from a symposium presented at the AACC annual meeting in Houston last summer. As speakers, we, along with James Westgard, PhD, were asked to talk about QC design in a real and practical manner. We discussed how it can be accomplished, and then demonstrated how it was accomplished in one lab, and the benefit the lab derived from it.
Six effective QC practices that don’t require advanced math
Improving laboratory quality is a continual process, and the labs that are most successful are those that take incremental steps. The following six strategies will move a lab in the right direction toward an optimal strategy. They all directly relate to reducing patient risk or minimizing cost of rework.
1. Always end patient testing with a QC evaluation. Virtually every lab starts its day running QC to ensure its instruments are functioning correctly before running patient tests, and this is a good practice. However, if an instrument malfunctions and incorrect test values are reported, when does the lab find out? If QC is only run at the start of the day, then the morning startup procedure or maintenance may correct a previous day’s problem, or the staff may troubleshoot and fix the problem without knowing whether the previous day’s results were affected and patient care was compromised. Performing a QC evaluation at the end of the day’s testing will give the lab the confidence that the day’s reported results were not compromised.
2. Make the time between QC evaluations shorter than the time needed to correct results. When a QC rule is violated and an out-of-control condition is identified, CLIA and ISO 15189 direct the lab to inspect and correct adversely affected patient results that have already been reported. A lab should consider how long it would take to review results; then identify, pull, and retest suspect results since the last passing QC. If the answer is unnerving, then the lab should consider shortening this time interval. A first step toward this strategy is to identify some high-volume tests or tests with short turnaround time requirements and then ask a few of the laboratorians who do the testing to work together and do some back-of-the-envelope calculations on how long it would take to review and retest.
3. Know the number of patient results between QC evaluations. Any lab can probably tell you how frequently it runs QC for a given analyte, but knowing the average number of patient results examined between QC events is another matter. For the laboratory, patient risk not only depends on the time between QC evaluations, but also on the number of patient results examined between QC evaluations. In the event of an out-of-control condition, it is the number of patient results examined between QC evaluations that determines the number of patients at risk of receiving incorrect results.
4. Estimate the magnitude of an out-of-control condition before correcting it. As mentioned previously, part of recovery from an out-of-control condition is reviewing and correcting patient results since the last passing QC. To do this well, the size of the out-of-control error should be understood. Before resolving the problem, the lab should run known patient samples or other characterized material to estimate the magnitude and direction of the shift in performance. This information can then be used to guide the recovery effort, enabling the lab to do a more cost-effective recovery.
5. If you’re using a 1:2s QC rule and you get a rule failure, repeat it—but just once. Dr. Westgard wisely warns against repeating QC until it passes. However, a single repeat 1:2s QC rule has recently been shown to have good power characteristics with a low false rejection rate. This repeat 1:2s rule reruns both QC samples just one time if either initial QC result fails. If any repeated QC result fails, the QC rule rejects and recovery activities begin.
6. Divide analytes into high/low sigma metric groups. The performance capability of a test can be easily expressed by combining three numbers—allowable total error, bias, and imprecision—into a sigma metric (more about this later). A simple but effective approach to QC is to design separate QC strategies for high and low sigma metric processes. High-performing tests (high sigmas) are easier to QC, and the lab can either select QC rules that reduce the false rejection rate or choose to strengthen its quality claim by selecting a smaller total allowable error. The first approach has a direct benefit to the lab, and the second approach could be of greater interest to clinicians. For lower-performing tests (low sigmas), the lab should seek ways to reduce bias and imprecision, increase the frequency of QC testing, or increase the error detection capability (power) of its QC rule(s).
Selecting a QC rule for HbA1c
The last strategy mentioned relies on knowing your sigma performance. The fact is, however, that many labs don’t have this information. Talking sigma metrics seems to scare off many, as there seems to be a belief that calculating sigma performance is complicated and requires advanced mathematical skills. In reality, only one simple equation is as complicated as it gets for the whole sigma-metric approach to selecting QC rules.
There are five basic steps to a sigma-metric approach to QC rule selection.
- Define the “tolerance specification.”
- Obtain the imprecision (CV or SD) data.
- Obtain the bias data.
- Calculate the sigma value.
- Use the sigma value to identify an appropriate control rule and number of QC samples.
For some, the hardest part of the process is defining the tolerance specification, or quality goal. One might look at proficiency testing goals, CLIA requirements, or other published goals, such as biological variation. If a lab hasn’t established its quality goal or allowable total error, its leaders needn’t be embarrassed; this is quite common and is an ideal initiative for a quality improvement project.
To demonstrate the simplicity, Dr. Westgard presented the following HbA1c exercise:
Step 1: Define the tolerance specification. This step is easy. CLIA says the glucose TEa is 10%, and CAP PT recommends an HbA1c TEa of 7.0%. Using CAP, our tolerance specification is 7.0%
Steps 2 and 3: Obtain the analytic performance data. Bias can be readily found in one of three places: in the initial method verification data, from PT survey data, or a QC peer comparison program. Imprecision can also be obtained from the initial method verification data (replication experiment) or from routine statistical QC data. The key is to be sure the TEa, bias, and CV are all in the same units.
Step 4: Calculate the sigma value. Assuming the CAP TEa of 7.0%, and a review of data shows a bias of 2% and CV of 1%, then use the formula (TEa – bias) / imprecision = sigma, or (7.0 – 2) / 1 = 5. This is the sigma value.
Step 5: For a sigma of 5, a sigma selection chart might indicate that a 1:3s rule with 2 QCs is acceptable. Sigma performance varies based on bias and imprecision, and labs with unacceptable sigma performance should review their processes to reduce either or consider an alternate method. This effect can be seen by reviewing three sets of characteristics all based on a TEa of 7.0 (CAP PT Target Value—Table 1).
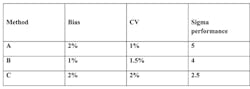
Table 1. Charting sigma performance
If the performance capability of tests (sigma values) is known, the lab can define appropriate QC rules for each level of sigma performance. Some labs have obtained efficiency improvements by grouping QC practices by sigma performance to ease the burden on staff.
Using sigma metrics to simplify QC across a healthcare network
Geisinger Health System, a large multi-site healthcare system in Pennsylvania, undertook a project to standardize QC policies and practices across multiple CAP-accredited sites. At the time, each site determined its own QC policies, rules varied widely across the system, and staff spent an inordinate amount of time troubleshooting QC failures that might be attributed to false rejections. The healthcare system had already been on a path to standardize platforms and connectivity, a crucial component for standardizing QC. This would allow monitoring of performance across the system and comparison of performance among sites.
The project was broken into phases with Chemistry starting first. In order to facilitate true performance comparison, it was determined that the labs had to standardize lot number of QC material and ensure that all sites were reporting QC on the same networked QC Data Management software that would allow them to aggregate monthly peer comparison statistics, calculate, and monitor their sigma performance on a regular basis using Westgard principles.
Armed with these tools and initial sigma values, the participating labs modified their QC rules into groups and selected a 1:3s rule for all tests meeting their threshold sigma performance. This encouraged labs with subperforming analytes, compared to the other sites, to work to improve bias or imprecision. The system has reaped benefits across the board. It now has standardized QC policies for all the participating sites, which simplifies training and auditing, False QC Rejection Rates have dropped dramatically (Figure 1), in some cases, more than 80%, leading to increased productivity resulting from the elimination of unnecessary QC repeats and resulting disruption at high-volume work stations. The benefits have been so significant that the sigma approach was recently expanded to high-volume hematology and coagulation tests, and additional areas are being considered. The program is seen as win-win for management, staff, and patients.
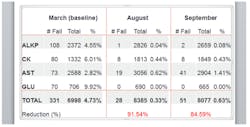
Figure 1. QC rejection rates showed a dramatic reduction within six months of implementation.
As demonstrated by Geisinger Health System, multiple benefits can be found by creating a QC Design that fits a laboratory or healthcare system’s goals. Whether these strategies are qualitative or quantitative in nature, and whether the goal is to minimize patient risk or reduce the cost of recovery, a QC Design doesn’t have to be complicated. While the derivation of statistical QC tools comes from advanced mathematical computations, laboratorians don’t need to be statisticians or have understandings of higher math in order to design effective QC practices. Improvement of QC practices in a lab simply requires the desire and the willingness to take incremental steps. With each step and sign of success, the next step becomes easier and more enticing.
Note: Andy Quintenz, Scientific & Professional Affairs Manager, Quality Systems Division, Bio-Rad Laboratories, contributed to this article.


About the Author

Curtis Parvin, PhD
is retired from Bio-Rad, where he was Manager of Advanced Statistical Research. Prior to joining Bio-Rad, Parvin was the Director of Informatics and Statistics at the faculty of Washington University School of Medicine.