CDC’s more restrictive policy on child lead testing means more positives and high QC

June will mark four years since the Centers for Disease Control and Prevention (CDC) halved its reference blood lead level (BLL) for children from 10 micrograms per deciliter (µg/dL) of blood to 5 µg/dL, the agency’s threshold for public health action.1 As the water supply contamination crisis in Flint, Michigan, illustrates, the spread of lead in the environment—as well as the resulting health impacts—has been insidious, perhaps even more so than public health agencies had anticipated just a few years ago. Labs play an increasingly important role in helping to detect higher levels of human exposure. This article will look at the reasons for the revised reference level, the laboratory experience since the policy shift, how labs test and guard against contamination, and why lead will continue to be a public health problem long after the crisis in Flint is resolved.
Genesis of policy change
The shift in policy came on the heels of a two-year investigation by a work group of the Advisory Committee on Childhood Lead Poisoning Prevention, which was chartered to provide guidance to the CDC and the U.S. Department of Health and Human Services. The group’s report cited newer research showing that any level of lead exposure can be detrimental to children.2 Even moderate exposure to lead is associated with cognitive development problems and lowered IQ.
“We have not been able to identify a safe blood level for children,” says Mary Jean Brown, PhD, chief of the CDC’s Healthy Homes and Lead Poisoning Prevention Branch. “We only use 5 because it is the top 2.5 percent of the population distribution [for lead exposure], which means something different is going on with that child.”
The report recommended that CDC move from a poison identification-based approach to a strict prevention-based approach. In due course, the CDC lowered the reference level and decided to update it every four years based on the results of two national surveys on lead exposure. The first cycle is about to end.3
A surge in positives
Hashim Othman, PhD, director of Toxicology & Special Chemistry at Bio-Reference Labs in northern New Jersey, says his facility has not done significantly more lead testing since the cutoff change. “But the rate of positives has increased tremendously!” he exclaims. “In August, when kids are tested before school, we see more than double the rate of positives than before. We used to have three, four, maybe five positives a day. Now we have 20, 30, maybe 40.” Most of the year, the lab runs 425 to 475 lead tests daily; during the preschool spike, it runs 550 to 650 tests a day.
His lab’s rate of positives seems to mirror the national trend. Back in June 2012, the CDC predicted the new reference level would increase the number of children affected nationwide from fewer than 100,000 to close to 373,000.1 Now it estimates that approximately 535,000 children ages one to five years have been found with blood lead at or above 5 µg/dL, says Bernadette Burden, a CDC spokeswoman. The estimate is based partly on the CDC’s biannual National Health and Nutrition Examination Survey (NHANES) and partly on the agency’s Childhood Blood Lead Surveillance System, which includes data from 35 state and local health agencies, many of which receive CDC funding.
Picture may be brighter
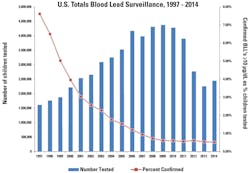
While the CDC estimate may sound dramatic, the exposure picture for children nationwide might not be as dire as the tragedy in Flint suggests. The percentage of children found with elevated blood levels (under the old reference level) has actually been falling steadily during the past decade. In fact, under the old reference level, the incidence rate has been below one percent since 2007 (Table 1).
One reason for the decline is the Residential Lead-Based Paint Hazard Reduction Act of 1992, which directs the Department of Housing and Urban Development (HUD) and the Environmental Protection Agency (EPA) to require disclosure of known lead-based paint and paint hazards before the sale or lease of houses built prior to 1978. While the EPA and HUD are charged with strict enforcement of the law, CDC tracks BLL exposures, provides technical and financial assistance to state and local childhood lead poisoning prevention programs, and makes policy. Dr. Brown is proud of her agency’s efforts. “Our surveillance data have shown that, in many communities, a small number of houses repeatedly poison children,” she says. “And with that information we’ve been able to work with HUD and EPA to enforce the lead disclosure rule.”
Industry perspective
The Association of Public Health Laboratories (APHL), representing some 800 state and local public labs, has taken a keen interest in efforts to reduce childhood lead exposure. The APHL is confident that current instruments and methodologies can detect lead concentrations below the current reference level. But members have heard that the CDC is considering lowering the level again, to 3µg/dL. With the growing use of point-of-care (POC) BLL testing instruments, the APHL is concerned that federal standards may outpace current POC technology.
“More clinicians are using point-of-care devices because they are quick, cheap, and easy,” says Sanwat Chaudhuri, PhD, chair of the APHL Environmental Health Committee. “But that technique is not as sensitive compared with the other techniques. And when you’re pushing the regulatory limit so low, then you are challenging the instrument, and that may affect the data that you’re getting.”
The most common lead testing methodologies are graphite furnace atomic absorption spectrometry (GFAAS), anodic stripping voltammetry (ASV), and inductively coupled plasma mass spectrometry (ICPMS). A portable device using ASV technology is also available for POC BL testing. According the World Health Organization (WHO), ICPMS is the most sensitive method for detecting BLL levels as low as ~0.1 μg/dl. That’s followed by GFAAS (lower limit: <1–2 μg/dl); lab-based ASV instruments (lower limit: 2-3 μg/dl); and portable ASV instruments (lower limit: 3.3 μg/dl).4
Testing and precautions
To determine lead exposure levels among children and adults, hospitals across the country send public and private labs blood samples each day. They are shipped in either tan- or lavender-capped vials—the colors indicate the level of assurance that the container holds an untainted blood sample. Othman says tan-capped vials are preferable; an extra preparatory step must be performed before lavender-topped vial samples are analyzed.
At his lab, samples are tested each night on three ICPMS instruments to have results for doctors by morning. Each instrument ionizes the sample, sorts and separates the ions by mass and charge, detects and measures the ions, and displays the results graphically for the user. Labs employ quality measures to ensure that the sample is untainted and the analyzer has accurately read what ends up on a graphic display.
“Here we have samples and quality controls,” Othman says, as a robotic arm inserts a pipette into one of 90 sample tubes nestled in a bread loaf-size rack. Because of the ubiquity of environmental lead, he says, labs like his across the nation must take precautions—such as controls, standards, and redundancy—to keep the testing process free of contamination.
First, whole blood controls with concentrations of lead at three known levels—normal (6.1 µg/dL), critical (13.7 µg/dL), and toxic (37.6 µg/dL)—are introduced. (The child reference level is <5 µg/dL and <25 µg/dL for adults). These are freeze-dried samples whose purity and lead concentration have been subjected to rigorous QC. The controls are processed and analyzed at the same time and in the same manner as patient samples. The result is then compared against acceptablevariance ranges.
“We dilute every sample and quality control 100 times with 0.5 percent nitric acid. We start the run with three controls, then alternate controls after every 30 samples. If we get five positives, those samples are run again on another rack. We do another dilution, add more controls—the same procedure. Then we compare the results. If they match, we release the original results. If they don’t match, we repeat the process a third time.”
Another critical measure involves the use of independently-validated blood-based NIST standard reference materials.5 The lab also adds a common internal standard for lead, bismuth, to each sample to ensure accuracy of results and instrument performance. Finally, a calibrator blank (0.5% HNO3) is included in each run. The system software uses the blank as a baseline for calculating the concentrations of all unknown samples.
Each sample is run three times, and the software then averages the three readings and provides a mean concentration and standard deviation, which must be less than 10 percent to avoid retesting.
“Any deviation from controls will depend, in large part, on how careful the technologists are and how good the controls and calibrators are,” Othman says, adding that CLIA sets the allowable error for controls: +/- 4 mcg/dL (equal to three standard deviations). “If you fail two controls, you have to do a corrective action. You either repeat a portion of the batch or the entire batch.”
Later the same morning, Othman is at his desk, sifting through a two-inch stack of BLL test reports. “Look at my calibration curve,” he says. “It’s almost perfect: 0.99999. And my calibration blank has only 129 counts of lead in it, which is considered very low compared to my lowest standard and then standards 2, 3, 4 and 5. As you can see, it’s a perfect curve.”
Satisfied, he initials the report.
REFERENCES
- Betts, KS. CDC updates guidelines for children’s lead exposure. Environ Health Perspect. 2012;120(7): a268.
- CDC. Low-level lead exposure harms children: a renewed call for primary prevention. http://www.cdc.gov/nceh/lead/acclpp/final_document_030712.pdf.
- CDC. CDC response to advisory committee on childhood lead poisoning prevention recommendations. http://www.cdc.gov/nceh/lead/acclpp/cdc_response_lead_exposure_recs.pdf.
- WHO. Brief guide to analytical methods for measuring lead in blood. http://www.who.int/ipcs/assessment/public_health/lead_blood.pdf.
- Parsons PJ, Chisholm Jr JJ. The lead laboratory. http://www.cdc.gov/nceh/lead/publications/1997/pdf/c1.pdf.