The effect on blood supply when implementing donor interval strategies to prevent iron deficiency
Earning CEUs:
Iron depletion in blood donors has been a topic of concern for the American Association of Blood Banks (AABB) over the past couple of years. In March 2017, the AABB published bulletin #17-02 recommending blood collection facilities implement additional actions to limit or prevent iron deficiency in blood donors. Three of the recommended strategies were to limit the donation interval for all individuals to two times in a 12-month period, limit 16–18 year olds to one donation in a 12-month period, and to limit pre-menopausal woman to one donation in a twelve month period. With a declining donor pool, the focus of this study is on additional effects of implementing the three aforementioned strategies on the blood supply of a southeastern community blood collection facility. Our findings suggest that if any of the three donation interval changes were implemented, there would be additional reductions in the blood supply.
Introduction
One of the physical screening practices required for donating blood in the United Sates is the measurement of hemoglobin or hematocrit prior to phlebotomy. A male donor is considered eligible if he has hemoglobin ≥ 13.0 g/dL or a hematocrit ≥ 39 percent. A female donor is considered eligible if she has hemoglobin ≥ 12.5 g/dL or a hematocrit ≥ 38 percent.1 During the donation process, a donor loses approximately 500 ml of blood volume, containing an estimate of 200–250 mg of iron.2 Despite the current practices of hemoglobin/hematocrit screening to protect the health of blood donors, one of the consequences of blood donation is iron depletion.
In its published bulletin #17-02 on March 16, 2017, recommendations from the AABB requested that blood collection establishments take additional voluntary actions to monitor, limit, or prevent iron deficiency in its blood donors.3 Currently, the stipulations in the 30th edition of the Standards for Blood Banks and Transfusion Services, only require donor centers to provide blood donors with education materials, which includes the risks of post donation iron deficiency that can be found in standard 5.2.1.5.4 The donors only need to acknowledge that they have received the materials with signature. Ooley (2016) outlines three additional iron mitigation recommendations along with strategies and interventions. The bulletin includes recommendations that blood establishments voluntarily implement one of the following strategies:
- Development of a program to provide replacement iron in absence of ferritin measurements.
- Measurement of serum or plasma ferritin.
- Evidence-based lengthening of donation interval, or restrict number of donations per year.
Under strategy number three, the lengthening interval and/or decreasing the number of donations per year provides three additional options. Option one limits whole blood donations to two times in a 12-month period, or one 2-unit collection in a 12-month period. Option two limits the number of whole blood collections from 16–18 year olds to one time in a 12-month period because of the higher documented rates of iron deficiency in young donors. Option three limits whole blood collections from premenopausal women to one donation in a 12-month period.5
Design
The research design for this study is a descriptive study using quantitative data from blood donors who donated whole blood from January 1, 2016–December 31, 2016 at a southeast community blood center.
Statistical analysis will be used for each of the following three options:
- Limit whole blood donations to two times in a 12-month period, or one 2-unit collection in a 12-month period.
- Limit whole blood collections from 16–18 year olds to one time a year.
- Limit whole blood collections from pre-menopausal women to one donation in a 12-month period.
Data set description
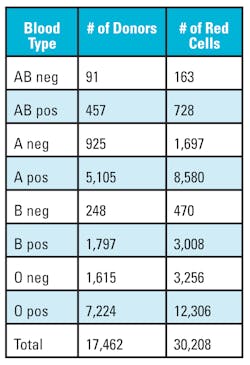
Data was gathered from the southeast community blood center’s blood bank computer system database, which contains 17,462 donors for fiscal year 2016. The data set does not contain names of the donors and was compiled into a spreadsheet for analysis. The fixed data fields were separated into the following columns:
- Donor number
- Gender
- Age
- Birth year
- Birth month
- Birth day
- Blood type
- Race
- Hgb/HCT
- Number of donations
Using the above data, calculations were made by limiting individuals to donating only two times in a 12-month period, limiting donors 16–18 years old to donating only one time in a 12-month period, or limiting pre-menopausal woman to only one donation in a 12-month period.
Data analysis
The Statistical Analysis System software was used to analyze the data set for for the three donor interval options:
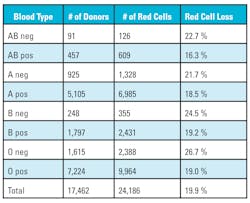
- For the option of limiting whole blood donations to two times in a 12-month period, or one 2-unit collection in a 12-month period, the following calculations were used: % Loss = Total Products – Total Products (removing donor collections > 2 donations in a 12-month period / Total Products x 100).
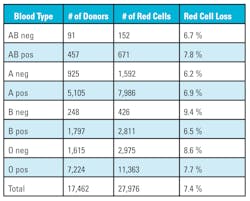
- For the option to limit whole blood collections from 16–18 year olds to one time in a 12-month period, the calculation is: % Loss = Total Products – Total Products (removing donor collections > 2 from 16–18 year olds in a 12-month period / Total Products x 100).
- For option three, limiting whole blood collections from premenopausal women to one donation in a 12-month period, the calculations used were: % Loss = Total Products – Total Products (removing donor collections > 2 from females < age 50 in a 12-month period / Total Products x 100).
Each of the three scenarios will reveal the percentage changed in the number of red cell units collected.
Limitations
The data extracted was from a period of time in the 2016 calendar year and does include fluctuations that occur year to year based on external factors such as natural disasters, community health outbreaks, additional mandated testing, and the state of the economy. Demographics differ from region to region; therefore, other community blood centers’ donor mix of age and gender may not correlate exactly with the southeast blood center’s database.
Results
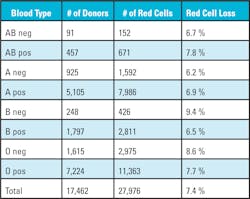
The data also highlights the loss of O negative red cells from 2.1 percent to a high of 26.7 percent. O negative red cells are considered the universal donor and used additionally for neonatal transfusions, traumas, and patients whose blood type is unavailable. Approximately eight percent of the U.S. population is O negative, but large medical centers with children’s hospitals or level one trauma centers use approximately 10 percent O negative red cells. The loss in O negative red cells is amplified because O negative donors usually donate more than two times a year because they understand the importance of their blood type.

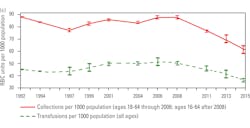
When the NBCUS data is converted into daily collections and transfusions, the numbers for the U.S. are 33,030 red cell units collected and 31,041 red cell units transfused. There is an estimated hospital wastage of 509 units per day bringing the total accounted for by the hospitals to 31,550 a day. What is not accounted for is the additional red cell supply cross-matched on hold for the patients that did not use red cells. Traditionally, hospitals try to keep 2-3 days of supply on their shelves to anticipate emergencies, and blood centers usually hold back 3-5 days of supply on their shelves because of unexpected drive cancellations, delay in testing, and emergencies.
Conservatively, it is assumed the hospitals keep an additional two day supply (63,100 units) on their shelves and the donor center keeps an additional three day supply (94,650 units) on their shelves, it equates to an additional 157,750 red cell units needed for daily inventory. Therefore, 11,673,500 red cell units are needed for minimal sustainability with collected usable units of 12,056,000 annually leaving a balance of 382,500 units. When converted to daily inventory, the U.S. has an extra 1,048 red cell units available if needed for an unexpected surge.
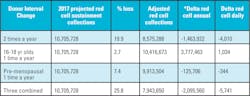
NBCUS numbers for 2017 have not been released, but if we estimate that the trend in collections and transfusions continue with a 11.2 percent reduction in collections and a 14 percent reduction in transfusions, the new calculations are 10,705,728 collected for anticipated sustainability and a transfusion need of 10,039,210 red cell units. The delta is 666,512 red cell units a year with a daily extra inventory of 1,826 red cell units for the U.S. which is greater than the 2015 daily inventory number of 1,048. This is good news if the assumptions are correct and no additional requirements are placed on blood centers that could potentially reduce available donors. This would not be the case if any of the changes to donation intervals are mandated based on this study. If percentage loss as calculated for the southeast community blood center is applied to the national numbers, the following scenario unfolds as depicted in Table 7.
Conclusion
The current sustainability of the blood supply is fragile and any additional requirements or restrictions that defer a donor will have an immediate negative impact on collections. Throughout the years blood collection facilities have absorbed the mandated donor deferrals mainly because the population was large enough for collections and the hospitals reduced transfusions. The new reality is baby boomers are switching from donors to users, and the younger generation is shrinking according to the U.S. census. The risk of implementing lengthening the donor interval, and/or decreasing the number of donations per year on the blood supply will negatively impact the southeastern community blood donor center.
If our results are mirrored by other blood collection facilities the reduction in red cell supply would be amplified across the nation. A side effect that has not been statistically modeled is the loss of donors, specifically the parents and 16–18 year olds with a possible negative public message. If any additional donor deferral criteria is implemented, will we finally enter an era of red cell demand exceeding supply?
REFERENCES
- Fung, M., Eder, A., Spitalnik, S., Westhoff, C. (2017). Technical Manual, 19th Edition. Bethesda, MD: AABB.
- Bialkowski, M., Bryant, BJ., Schlumpf, K., Wright, D., et al. (2015). The strategies to reduce iron deficiency in blood donors randomized trial: design, enrolment and early retention. Vox Sang, 108(2):178-185.
- Szczepeorkowski, Z., Hopkins, T. (2017) Updated strategies to limit or prevent iron deficiency in blood donors. AABB Associated Bulletin, 17-02.
- Ooley, PW. (2016). Standards for blood banks and transfusion services, 30th edition. Bethesda, MD: AABB.
- Szczepeorkowski, Z., Hopkins, T. (2017) Updated strategies to limit or prevent iron deficiency in blood donors. AABB Associated Bulletin, 17-02.
- Ellingson, K., Sapiano, M., Haass, K., Savinkina, A., et al. (2017). Continued decline in blood collection and transfusion in the United States-2015. Transfusion, 57(2S):1588-1598.
- Angelantonio, E., Thompson, S.G., Kapotage, S., Moore, C., Walker, M., Armitage, J. (2017). Efficiency and safety of varying the frequency of whole blood donation (INTERVAL): a randomized trial of 45,000 donors. Elsevier Ltd Open Access 4.0 license.
- Borreli, L. (2013). Why Donating Blood is Good for Your Health. Healthy Living, 1-9.
