Assessing the suitability of NGS panels for clinical sequencing
Next generation sequencing (NGS) is beginning to live up to its promise in clinical diagnostics, but obtaining data that influences diagnostic decisions and patient outcomes requires products that deliver consistent, high-quality results. GMP (Good Manufacturing Practices)-compliant manufacturing is an indicator of such quality and consistency; however, clinical lab scientists still need to assess each new tool and product for clinical utility before integrating it into the workflow.
To determine the underlying genetics of disease states, various commercial NGS panels are available and increasingly prevalent in the clinical laboratory. Whole genome sequencing has limited utility in clinical diagnostics due to its cost and time drain, but targeted panels make variant calling cheaper, faster, and more accessible.1 Panels range from those that cover the human exome to those specifically targeting a particular disease or range of conditions, such as cancers, and inherited and rare diseases. Where there is an even smaller subset of genes of interest or a need to target a specific combination of genes, various vendors offer customized target enrichment panels, further improving cost-efficiency.
Regardless of panel choice, for clinical utility, a panel must provide the level of quality and accuracy required for clinical samples. As each vendor employs differing technologies and manufacturing methods, quality and accuracy can vary to a surprising degree.
A study of NGS panels
To determine the suitability of an NGS panel for the production of clinical data, lab leaders need to assess several key performance factors. Common factors that influence targeted NGS include:
- Accurate and sufficient enrichment of targets
- Sufficient depth and uniformity of coverage
- Reliability of reads through GC-rich regions
Data from a recent study conducted by a large independent genome center illustrate the relevance of meeting these challenges in diagnostics. The study evaluated several key metrics of four commercially available clinical exome panels. While exome panels themselves are not commonplace for routine diagnostics, their data, generated in clinical research, feed into content on smaller targeted panels. Given that exome panels contain a vast amount of content, a detailed analysis of their performance makes an excellent test of robustness of the target enrichment technology, probe design, and manufacturing method. The performance of a given exome panel also indicates the performance of targeted diagnostic panels developed with the same methods.
The study selected hybridization-based panels from different vendors with comparable target spaces covering the human exome. The metrics compared were on-target performance, depth and uniformity of coverage, and guanine-cytosine (GC) content bias. The results demonstrate the variability between similar panels, highlighting the importance of thorough assessment before integrating with workflows.
Key NGS performance metrics
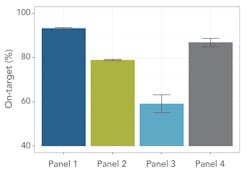
Probe design and enrichment protocols influence on-target performance, measured as the ratio of bases within a target region to total bases output by the sequencer. A higher on-target percentage indicates that more probes successfully bind to the intended target under the given hybridization conditions. This improves accuracy and reduces off-target noise, simplifying analysis. Taking a similar number of sequencing reads, 34 million reads per library, the study calculated the percentage of probes on-target across a 250 bp flanking region covered by all panels, enabling a comparison (Figure 1).
The study also assessed the coverage depth and uniformity across intended target regions. Reliable variant calling depends on sufficient depth of coverage, generally accepted to be 20x or more,2 to minimize the risk of false positives and missing variants due to insufficient data.
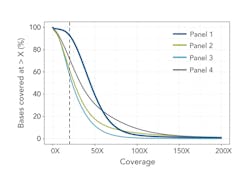
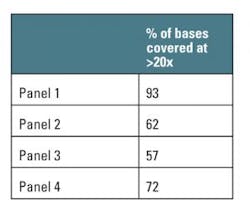
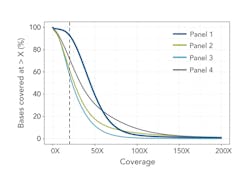
Each panel’s BED files provided target and probe locations, allowing for a bioinformatics comparison of coverage (Table 1). A further comparison to the human reference sequence database, RefSeq3, normalizes these data to the annotated human exome (Figure 2). This provides an indication of how well the panels cover the exome, and therefore potential clinical relevance of any diagnostic panels based on the same technology.
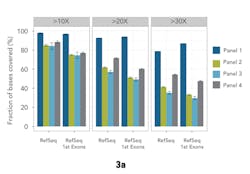
A common challenge in diagnostics is generating sufficient reads through the first exons of genes, where GC content tends to be higher than average. Methods to compensate for GC bias in sequencing do exist1,4; however, it continues to pose a challenge for efficient probe binding for target enrichment. Unreliable first exon data reduces confidence in analysis, and potentially leads to missed variants. The study compared the percentage of bases with >10x, >20x, and >30x coverage for each panel in first exon locations taken from RefSeq with the database as a whole (Figure 3a). Any GC bias in the panels shows as a reduction in first exon coverage relative to the whole database.
Exploring the data
The data from these comparisons indicate that the key performance metrics vary noticeably among panels.
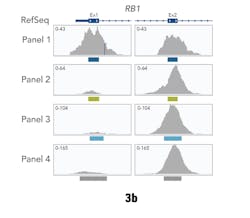
In these tests, Panel 1 performed more consistently than the others. It demonstrated an on-target percentage slightly higher than that of Panel 4, and provided more uniform coverage of the exome. At 20x depth, suitable for variant calling, Panel 1 covered 93 percent of target bases versus 72 percent by the next closest panel. These profiles remained consistent when normalizing to RefSeq gene locations. Panel 1 also remained more consistent with increasing coverage depth for first exon enrichment, as demonstrated by the example from the gene RB1 (Figure 3b).
Several distinctions that may account for the difference in performance between Panel 1 and the other panels include probe length, probe composition (DNA vs. RNA), and the manufacturing method. Panel 1 contained column-based individually synthesized DNA probes, affording individual re-synthesis should quality control checks identify any stochastic failures. The resulting 120mer full-length probes, pooled at equimolar concentrations in the panel, display reduced GC content bias.
Some of the other panels consisted of array-synthesized probes, which also suffer stochastic synthesis failures, but do not afford individual probe re-synthesis. As a result, those panels are likely to contain probes of heterogeneous lengths and greater variation among batches, potentially requiring multiple sequencing runs to confirm the presence of a clinically significant variant. One of the panels uses RNA probes, which are known to have an inherent GC bias.
The performance differences among individual probes resulting from the two manufacturing approaches are probably minor, but also are likely to be compounded across multiple probes, targets, and whole panels.
Takeaways for decision makers
Accurate and reliable data are critical in diagnostics, requiring clinical lab scientists to carefully evaluate the NGS tools they select for use. The independent study identified and tested several key metrics and demonstrated the performance variability between NGS panels with similar target spaces.
The results indicated that the panel built with individually synthesized, 120mer DNA probes provided the most consistent performance. Given the need for high quality data, the ability to enrich GC-rich regions is of particular significance in diagnostics where the successful identification of a disease-relevant variant may rely on accurate first exon sequencing.
The implication of these results is that batch-to-batch variation and the potential need to repeat sequencing runs may outweigh the initial cost-savings of array-synthesized panels, and negate some advantages of targeted enrichment. Clinical laboratory scientists therefore need to consider new NGS panel technologies as they come to market, and evaluate them for suitable on-target performance, coverage uniformity, and GC bias before selecting for clinical use.
REFERENCES
- Garcia-Garcia G, Baux D, Faugère V, et al. Assessment of the latest NGS enrichment capture methods in clinical context. Nature Scientific Reports. 2016;6. doi: 10.1038/srep20948.
- Lelieveld SH, Spielmann M, Mundlos S, et al. Comparison of exome and genome sequencing technologies for the complete capture of protein-coding regions. Human Mutation. 2015;36(8):815–822.
- O’Leary NA, Wright, MW, Brister JR, et al. Reference sequence (RefSeq) database at NCBI: current status, taxonomic expansion, and functional annotation. Nucleic Acids Res. 2016 Jan 4;44(D1):D733-45.
- Benjamini Y, Speed TP. Summarizing and correcting the GC content bias in high-throughput sequencing 2012;40(10), e72. doi: 10.1093/nar/gks001.
Kristina Giorda, PhD, serves as a staff scientist in the NGS scientific applications group at Integrated DNA Technologies. She completed her doctorate in molecular and cellular biology at the University of Massachusetts at Amherst, where she studied the viral entry and release mechanisms of SV40. Kristina now focuses on NGS applications development and collaborations, including assessing and improving IDT’s individually synthesized xGen Lockdown probes and panels.
