MLO’s 2019 Annual Salary Survey of laboratory professionals

“Many people take no care of their money till they come nearly to the end of it, and others do just the same with their time.” —Johann Wolfgang von Goethe
Releasing financial information—whether to a spouse, bank, accountant, or magazine—is often uncomfortable and can feel like an invasion of privacy. Yet, anonymous salary surveys provide a unique set of data to both businesses and professionals, drawing information from numerous sources for various job categories which are then broken down by geographic area, market sector, job function, etc.
According to the Bureau of Labor Statistics (BLS) Occupational Outlook Handbook,1 the median annual wage for medical and clinical laboratory technologists and technicians was $51,770 (or $24.89 per hour) in May 2017. To put things a bit more in perspective, as per BLS, the median wage for workers in the United States in the fourth quarter of 2017 was $44,564 (or $21.43 per hour) per year for a 40-hour workweek.2
So, without further ado, below you’ll find our salary survey results broken down by question, enabling a more complete look at the trends in the clinical laboratory industry.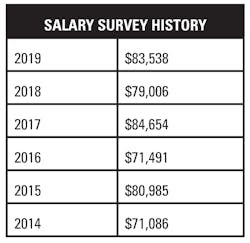
Where is your facility located?
Geographically, the salary breakdown for the 2019 survey is as follows:
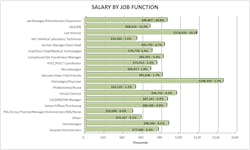
Which title BEST describes your current position?
MLO has a diverse readership within the laboratory. Following is a snapshot of the three most popular positions and their average salaries:
Which lab facility best describes where you work?
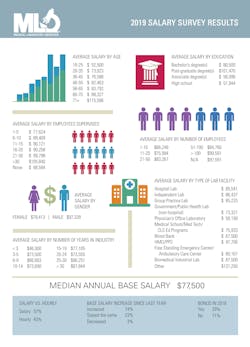
Seventy-six percent of our readers responded that they work at a hospital lab making an average salary of $85,541. The average salary of a non-hospital lab this year is $77,317.
How many employees work in your lab?
The majority of our readers report that more than 100 people work in their lab (25 percent). Twenty-three percent report 21-50 people, and 20 percent report 1-10.
How many employees do you currently supervise?
Thirty-two percent of respondents reported they do not currently supervise any employees and have an average salary of $68,594. Sixteen percent reported they currently supervise one to five employees and their average salary is higher, at an average of $77,624.
How many years have you been employed in the lab industry?
The average amount of years that our participants have been employed in the lab industry is 27. The average salary for those employed in the industry for 25-30 years is $90,257 which represents 16 percent of those polled. Interestingly, those who have been employed more than 30 years in the industry reported having an average salary of $87,844 and represent 55 percent of respondents.
How long have you been with your current employer?
2019’s average amount of years spent with a current employer is 17. Twenty-one percent of those polled reported they have been with their current employer more than 30 years.
How many hours is your normal shift?
Sixty-three percent of our readers answered that they work eight hour shifts with an average salary of $79,979.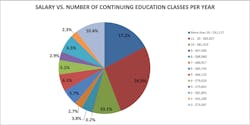
What is your highest level of education?
This year 59 percent of respondents reported having a bachelor’s degree earning an average of $80,500. We broke this statistic down even farther: females earned an average of $78,405 and males earned an average of $88,402.
Females are earning about $10k less than their male counterparts, signifying that the wage gap is a reality that females will continue to experience in the laboratory workplace. The amount of bachelor’s degrees is down from the average of 63 percent from last year.
Twenty-eight percent of those polled reported having post-graduate degrees, earning an average of $101,470, representing that with more education comes a higher salary.
Eleven percent responded that they hold associate degrees (average salary of $58,096) and one percent hold high school diplomas (average salary of $51,944).
What certifications do you hold?
The top three certifications held by our survey respondents are as follows:
- American Society for Clinical Pathology (ASCP) – 69 percent
- Medical Technologist (MT) – 49 percent
- Clinical Laboratory Scientist (CLS) – 16 percent
What organizations have you received professional certifications from?
The top three organizations that our respondents hold professional certifications from are as follows:
- American Society for Clinical Pathology (ASCP) –74 percent
- State certifications – 14 percent
- National Credentialing Agency for Laboratory Personnel (NCA) – 9 percent
How many continuing education (CE) courses did you take last year?
It remains clear that laboratorians are committed to expanding their knowledge. The 2018 survey reported 54 percent took ten or more classes in 2017—the statistics remained the same this year.
Twenty-seven percent of those polled responded that they took between 11 and 20 CE courses in 2018. Seventeen percent responded that they took more than 20. Only ten percent replied that they had not taken any CE courses last year.
What is the annual volume of testing in your lab?
When asked about the annual volume of lab testing, the results were as follows:
- Twenty-three percent run between one million to two million tests per year. This is up two percent from last year’s 21 percent.
- Twenty percent reported running between 100,000 and 500,000 per year.
- Seventeen percent reported running between 500,000 and one million per year.
- Fourteen percent reported running more than two million tests per year, which is down around one percent from last year.
Are you an hourly or salaried employee?
Forty-three percent of our readers are hourly employees earning an average annual salary of $66,908 (or $32.17 per hour).
Fifty-seven percent responded they are salaried employees earning an average salary of $95,988 (or $46.15 per hour, if they average an eight-hour day)—a significant increase from their hourly counterparts.
What is your annual 2019 base salary expected to be?
The median salary expectation for 2019 is reported to be $75,000-$79,999.
Did your salary change in 2018?
Seventy-four percent of respondents’ salaries increased in 2018. Last year 68 percent of respondents reported an increase. Twenty-three percent reported staying at the same salary, and three percent responded a decrease.
What percentage increase do you expect in 2019?
Forty-eight percent of respondents this year expect to receive a two to four percentage increase in 2019.
Did you receive a bonus as part of your 2018 compensation?
Seventy-one percent did not receive a bonus in 2018. Twenty-nine percent did.
What benefits does your employer offer you?
Overall, things look pretty good on the benefit front. Ninety-eight percent of respondents’ employers offer health insurance. Ninety-four percent have dental, 92 percent have a 401k or pension plan offered, 87 percent have vision, and 86 percent have life insurance.
How secure do you feel in your current position?
Ninety-two percent of respondents reported feeling very secure or somewhat secure in their position. Six percent reported feeling somewhat insecure and only two percent reported feeling very insecure.
How satisfied are you with your job?
Eighty-eight percent of survey respondents feel very satisfied or somewhat satisfied with their job. This is up about one percent from last year (87 percent either very or somewhat satisfied). Only 12 percent of respondents reported feeling somewhat dissatisfied or very dissatisfied.
What impact does the current shortage of medical professionals have on your lab’s operational efficiency?
Speaking of the future of the medical laboratory, the current shortage of medical professionals is a problem that many professions within the healthcare industry are feeling. Forty-three percent of those surveyed responded that the shortage was impacting their lab a moderate amount, 21 percent said a large amount, 26 said a low amount, and 10 percent reported no impact at all.
Has the current medical personnel shortage caused your lab to outsource more tests in 2018?
Eighty-five percent of respondents reported they have not outsourced more tests due to the personnel shortage.
Which have been the focuses of your laboratory’s outreach efforts?
Those who responded to the survey replied as follows in regard to their lab’s outreach efforts:
- Physician practices – 53 percent
- Nursing homes – 32 percent
- Community members – 28 percent
- Other laboratories – 22 percent
- Home care – 19 percent
- None (no outreach efforts) – 19 percent
- Minimal outreach efforts – 16 percent
Which areas of your lab have embraced molecular diagnostics?
Sixty-seven percent said their microbiology area has embraced molecular diagnostics, which is comparable to last year’s response. Twenty-nine percent do not know, 12 percent said the chemistry area embraced molecular diagnostics, eight percent said hematology, and four percent said the blood bank.
Did your lab automate or further automate new procedures in 2018?
An almost even split of 49 percent saying yes and 45 percent saying no on whether or not their lab automated new procedures in 2018.
Please tell us your age
Most of our survey respondents are 56-65 years of age (41 percent) and make an average of $83,792. Those aged 18-25 reported making an average of $52,500 per year.
Please tell us your gender
Seventy-six percent of our survey respondents were female, 23.3 percent male, and 1.1 percent did not answer.
In conclusion
Some of these statistics would certainly be beneficial to show those who are considering entering the lab industry; it’s doubtful that there is any other industry that expresses a feeling of security at 92 percent! In general, healthcare can be a very rewarding job, therefore it is not a huge surprise that our readers report they are satisfied with their current job.
The sentiment that money can’t buy happiness has been around for decades. At the end of the day, we all know money only gets you so far! As laboratorians, often goodwill and science supersede the importance of income, and as human beings, it’s how we spend our time on this earth that matters, not how we spend our money, isn’t it?
REFERENCES
- BLS.gov. (2019). Medical and Clinical Laboratory Technologists and Technicians: Occupational Outlook Handbook: U.S. Bureau of Labor Statistics. [online] Available at: https://www.bls.gov/ooh/healthcare/medical-and-clinical-laboratory-technologists-and-technicians.htm [Accessed 5 Apr. 2019]
- BLS.gov. (2019). Medical and Clinical Laboratory Technologists and Technicians: Occupational Outlook Handbook: U.S. Bureau of Labor Statistics. [online] Available at: https://www.bls.gov/oes/2017/may/oes292010.htm [Accessed 5 Apr. 2019]